How to Read a Retention Curve: Spot the Flattening That Signals Fit
A retention curve that flattens is the clearest usage signal of product-market fit. How to build one with cohort analysis, a worked example with the formula, bounded versus unbounded retention, and how much data you need before you trust it.
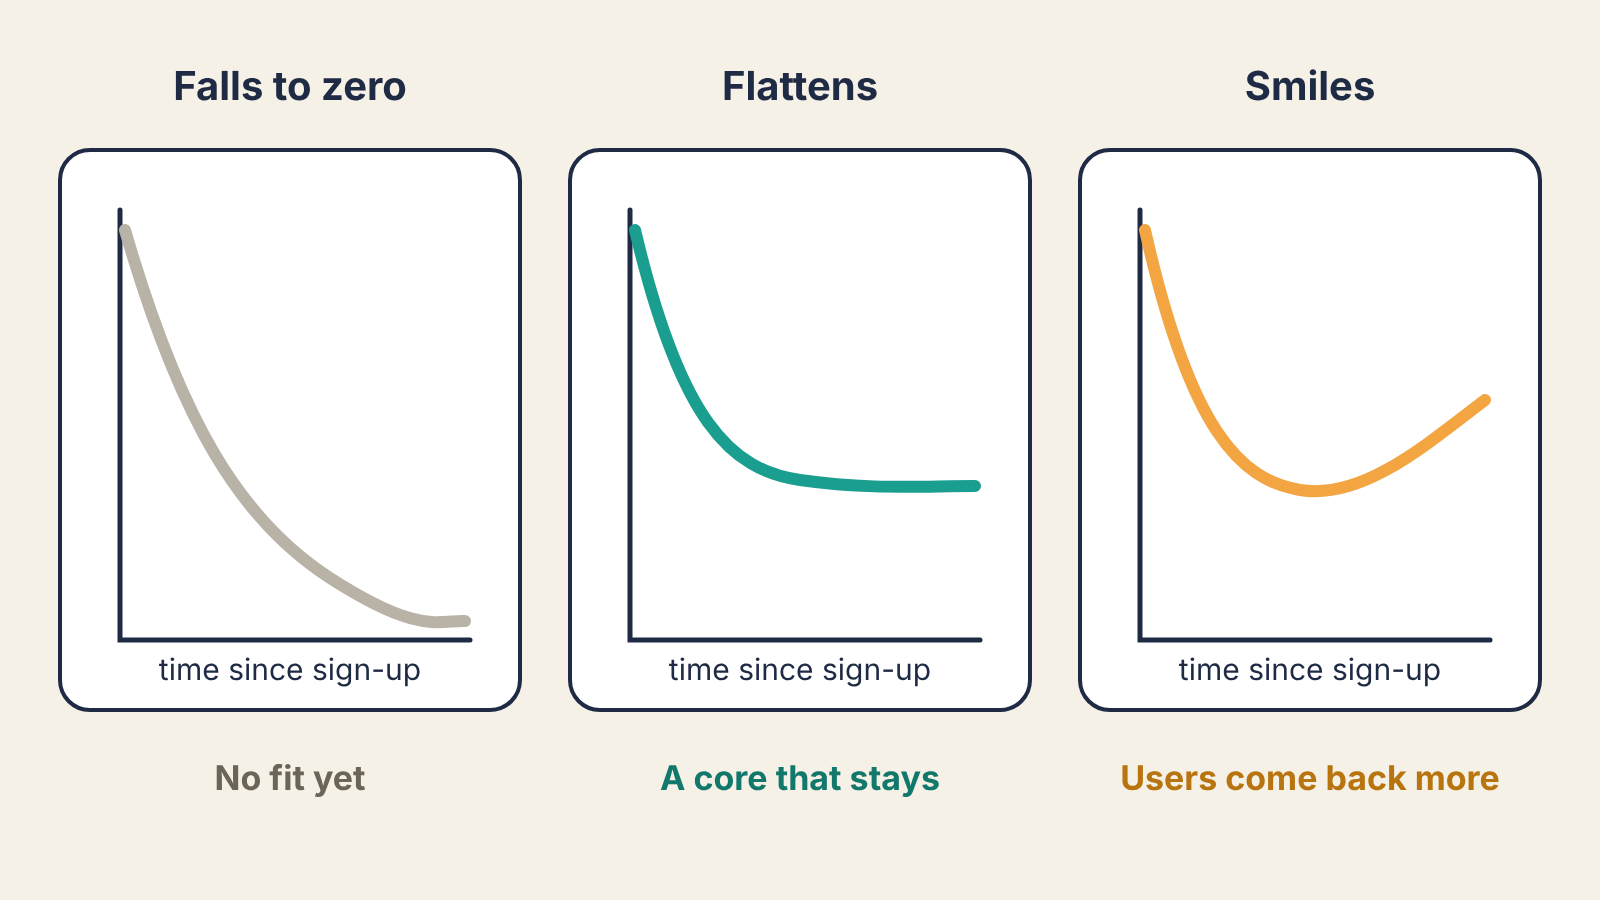
A retention curve shows what share of a group of users is still active at each point after they signed up. The single thing to look for is whether it flattens. A curve that keeps falling toward zero means every user eventually leaves, no matter how fast you acquire them. A curve that levels off means some users have found a lasting reason to stay, and that flat part is the strongest usage signal of product-market fit you can get from your own data.
This post covers how to build the curve, how to do the cohort analysis behind it, and how to read it without fooling yourself.
The definition and the formula
Group users into cohorts by when they started, usually by sign-up week or month. For each cohort, count how many were active in each period after sign-up.
Retention in period N = users from the cohort active in period N ÷ users in the cohort
Period 0 is the sign-up period, so it is 100% by definition. Plot periods 1, 2, 3 and so on, and you have a retention curve for that cohort. Average several cohorts, weighted by size, and you have the product's curve.
Two choices decide whether the curve means anything.
What counts as active. Pick the action that delivers the product's value, not a login. For an invoicing tool that is sending an invoice; for a note app it might be creating or editing a note. Logins inflate retention with people who opened the app, looked around and left.
The period length. Match it to how often a person with the problem would naturally use the product. A messaging app should be measured daily or weekly. A payroll tool used twice a month should be measured monthly. Measuring a monthly product weekly makes healthy users look like churners, and the curve will never look flat.
A worked example
Say you run a small B2B tool and measure monthly. These are illustrative numbers:
| Cohort | Users | Month 1 | Month 2 | Month 3 | Month 4 | Month 5 |
|---|---|---|---|---|---|---|
| January | 200 | 46% | 35% | 30% | 28% | 27% |
| February | 250 | 44% | 33% | 29% | 27% | |
| March | 300 | 50% | 40% | 36% |
Each row is one cohort. Read across a row to see how that cohort decays. The empty cells are months that have not happened yet, which is why a cohort table is a triangle.
Take the January row and work out the drop between months: 46 → 35 is 11 points, 35 → 30 is 5, 30 → 28 is 2, 28 → 27 is 1. The losses shrink fast and are close to zero by month 5. That is a curve flattening at roughly 27%: about one in four January sign-ups is still sending invoices five months in.
To get a blended month-1 figure, weight by cohort size rather than averaging the percentages: (0.46 × 200 + 0.44 × 250 + 0.50 × 300) ÷ 750 = (92 + 110 + 150) ÷ 750 = 46.9%. A plain average of the three percentages gives 46.7%. The gap is small here and large when cohort sizes vary a lot, for example after a launch spike.
Reading the shape
- Falls to zero. Every period loses a similar share of who is left, and the line heads for the axis. People try the product and none of them form a habit. More acquisition will not fix this; it only fills a leaking bucket faster.
- Flattens. Early periods drop sharply as tourists leave, then the losses shrink until the line is close to level. The users on the flat part are your core. Study who they are: role, company size, the first thing they did.
- Smiles. The curve dips, then rises, because some lapsed users come back and the core uses it more. This is rare early on and usually shows up in products whose value grows with data or with a team using it.
The level where the curve settles depends heavily on the category, price and how often the problem occurs. Published benchmarks exist, but most come from a single vendor's customer base or a handful of companies and disagree with each other, so treat any "good retention is X%" figure with care. Your own curve flattening, and the flat part rising cohort over cohort, is the signal that matters.
Reading across cohorts
Compare rows at the same month. In the example, March holds 36% at month 3 against 30% for January and 29% for February. If you changed onboarding at the start of March, that is evidence it worked, though one cohort of 300 is a thin basis for a verdict. Watch whether April and May keep the gain.
Read down the diagonal too. Cells on the same diagonal happened in the same calendar month. If every cohort dips in the same calendar month, look for an outage, a holiday or a pricing change, not a problem with any one cohort.
Bounded or unbounded: say which you used
Analytics tools offer two ways to count a user as retained, and they give very different curves for the same data.
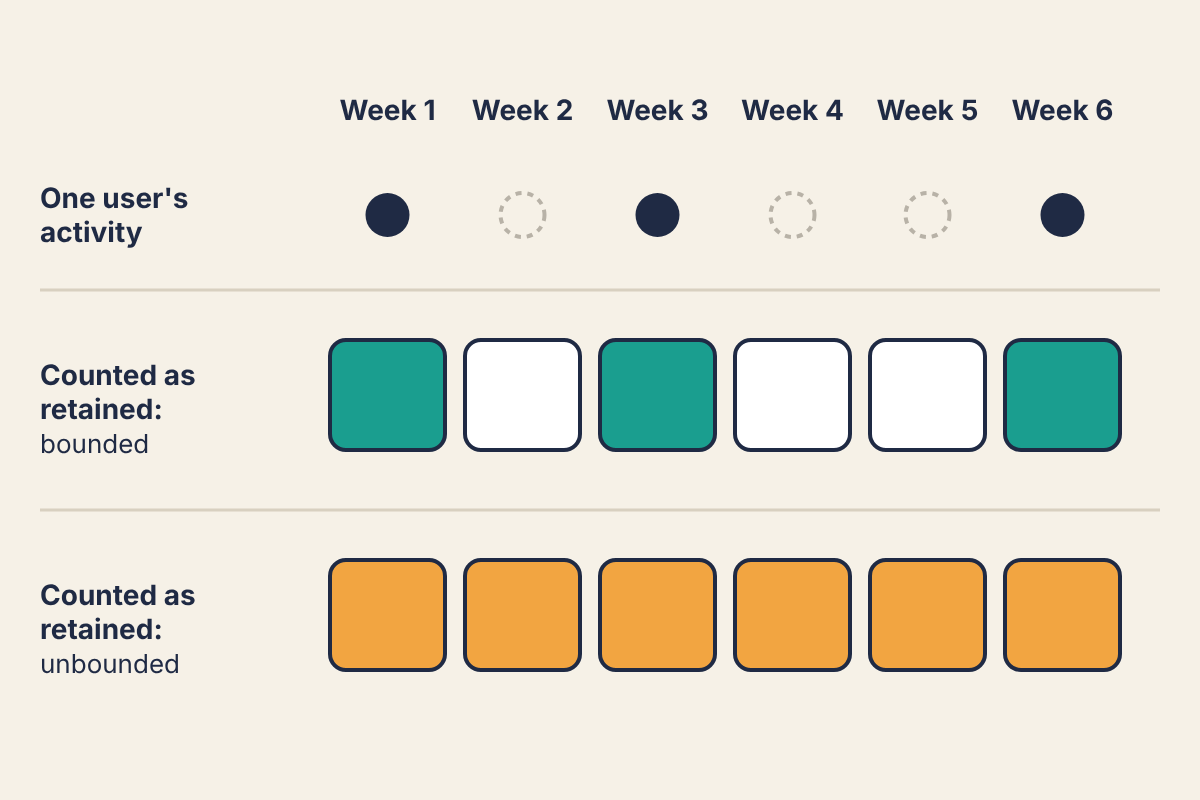
Bounded (sometimes called classic or N-day) retention counts a user in a period only if they were active in that period. Unbounded (also called rolling) retention counts them in every period up to the last one they were active in. Unbounded curves always look better and can never rise, so they hide a smile. Use bounded retention for judging fit, and state which one you are showing whenever you share a curve.
Sample size and when to trust the curve
With a cohort of 50 users, each user is 2 points of retention (1 ÷ 50). A cohort that "improved" from 30% to 34% may differ by two people. Before you read anything into a single cohort, check its size; if your cohorts are small, pool several months together, or move from weekly to monthly cohorts, until each has at least a couple of hundred users.
Also give the curve time. You need several periods past the initial drop before you can tell flattening from a slow decline. For a monthly product that means waiting four to six months of data per cohort, which is one reason early teams pair the curve with a faster signal like the "very disappointed" survey described in our Superhuman product-market fit teardown. The survey tells you who loves the product now; the curve tells you whether they keep using it.
What to run this week
- Write down the one action that means a user got value, and the period that matches how often your users have the problem.
- Export sign-up date and dates of that action per user. A spreadsheet is enough: one row per user, one column per period, 1 if active.
- Build the cohort triangle with bounded retention, and note each cohort's size next to it.
- For your oldest cohorts, compute the drop between consecutive periods. If the drops are shrinking toward zero, find the users on the flat part and list what they have in common.
- If every curve is still heading for zero after several periods, stop spending on acquisition and go back to customer discovery interviews to find out who the product is for.
