Superhuman's Product-Market Fit Engine: How a 22% Score Became 58%
A product-market fit case study of Superhuman: how one survey question, a narrower segment and a roadmap split in half took its very-disappointed score from 22% to 58%, and how to run the same numbers on your users.
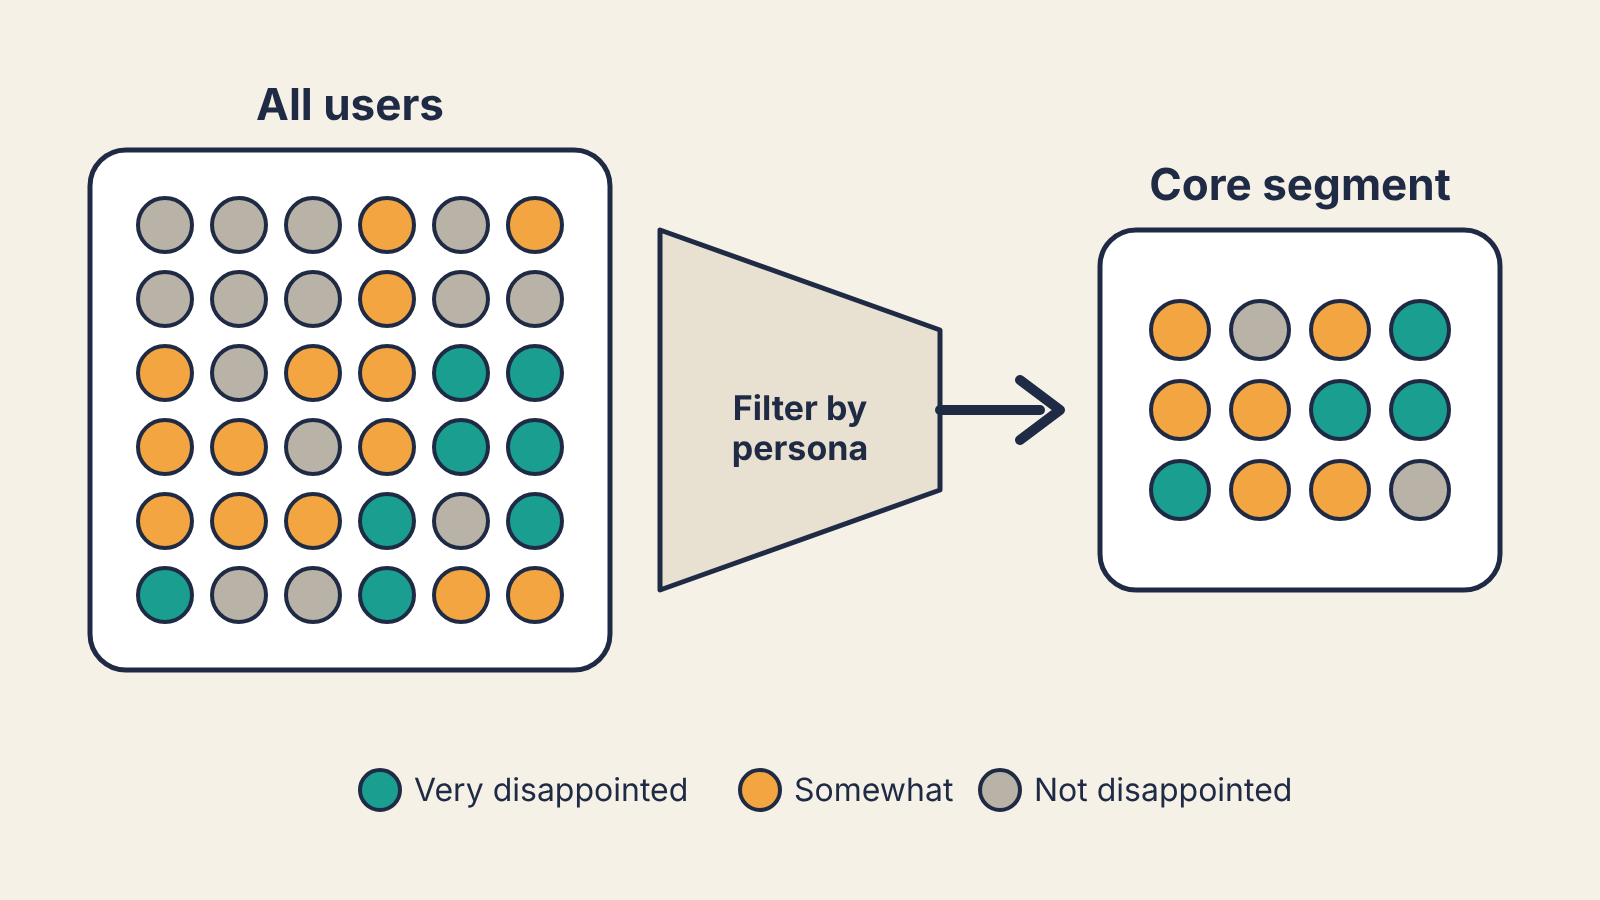
Superhuman did not find product-market fit by shipping a breakthrough feature. It found it by measuring fit with one survey question, cutting the score down to the users the product was really for, and then splitting the roadmap between those users and the ones who almost loved it. Rahul Vohra, the founder, published the whole method in First Round Review (also on Superhuman's own blog). This startup teardown walks through what the team did, what the numbers say, and which parts you can borrow if your own product sits in the "people like it, nobody needs it" zone.
Every figure below comes from Vohra's account. It is a founder describing his own company, so read it as a well-documented single case rather than an audited result.
The problem: building for years without a fit signal
Superhuman is a paid email client built for speed. By Vohra's account, the team had spent a long stretch building before launch and felt pressure to ship, yet had no way to tell whether the product was ready. Traction metrics are a lagging signal; by the time growth stalls, you have already scaled the wrong thing. Vohra wanted a leading indicator that a small team could measure and move.
He found it in the survey Sean Ellis developed. It asks users one question: "How would you feel if you could no longer use [the product]?" with three answers: very disappointed, somewhat disappointed, not disappointed. Ellis benchmarked roughly a hundred startups and found that the ones that struggled to grow almost always had fewer than 40% of users answering "very disappointed", while those that grew easily were usually above it. That 40% line comes from one practitioner's benchmark, not a controlled study, and it is still argued over. It is useful as a threshold to steer by, less useful as a law.
The starting score: 22%
When Superhuman first ran the survey in 2017, 22% of respondents said they would be very disappointed. Well short of 40%.
The survey Vohra describes had four questions:
- How would you feel if you could no longer use Superhuman? (very / somewhat / not disappointed)
- What type of people do you think would most benefit from Superhuman?
- What is the main benefit you receive from Superhuman?
- How can we improve Superhuman for you?
The first question gives the score. The other three tell you who the product is for, why they love it, and what blocks everyone else. Most teams that copy the Ellis test stop at question one, and that is where most of the value is lost.
Step one: segment before you build
The first move was not a product change. The team looked at who answered "very disappointed" and what roles those people held, then narrowed the denominator to the personas that loved the product most: founders, executives, managers and business development people. Within that segment the score rose from 22% to 33%, according to Vohra, with nothing shipped.
This looks like moving the goalposts, and in a sense it is. The point is that a product cannot be everything to everyone at an early stage. Segmenting tells you which market you already fit, so the roadmap can serve that market instead of averaging across people who will never convert. Vohra also leaned on Julie Supan's idea of the "high-expectation customer": the most discerning people within that segment, whose needs set the bar for the product.
Step two: read the "somewhat disappointed" answers carefully
Next the team asked why the "very disappointed" users loved the product. The main benefit they named was speed. Then came the part most founders skip: the team looked at "somewhat disappointed" users, and split them in two.
- Users for whom speed was also the main benefit. They wanted the same thing as the fans and were held back by something specific. Vohra lists items like a mobile app, integrations, attachment handling, calendaring and better search.
- Users for whom speed was not the main benefit. Even a perfect version of what they asked for would probably not turn them into fans, so their requests were noted and set aside.
That second cut is the discipline that matters. Requests from people who do not value your core benefit are the ones that pull a product into mediocrity.
Step three: split the roadmap in half
Superhuman then divided its roadmap. Half of the work went to making the main benefit stronger for the users who already loved it (more speed, more keyboard shortcuts, more automation). The other half went to the blockers named by the "somewhat disappointed, values speed" group. Each item was ranked by cost and impact, so the cheap, high-impact fixes went first.
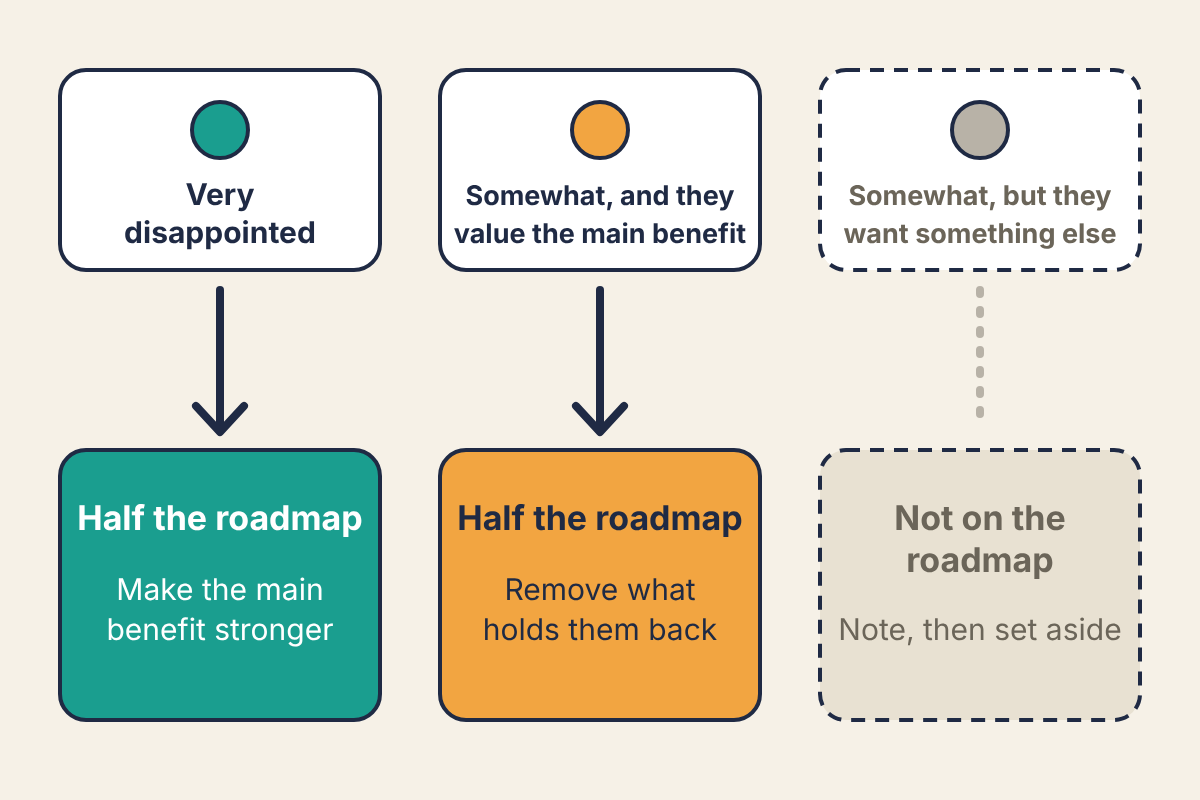
Doing only the first half deepens love among a group that may be too small. Doing only the second half chases converts while the core weakens. The split keeps both going.
Step four: track the score as the main metric
The survey was rerun on new users regularly, and the "very disappointed" share in the target segment became the number the team managed to. In Vohra's account, the score reached 58% within about three quarters of starting the process. Secondary write-ups report the intermediate quarterly figures slightly differently, so treat the path between 33% and 58% as approximate; the start and end points are consistent across tellings.
What the team knew then versus what we know now
It is easy to retell this as a clean formula. At the time, the team knew three things: its score was 22%, the 40% benchmark existed, and its fans valued speed. It did not know that segmenting would add eleven points, or that the roadmap split would carry the score past 40%. Those are results, reported after the fact by the founder.
Hindsight also hides some costs. Narrowing to a segment means saying no to users who asked for help. And a survey score is self-reported: "very disappointed" measures stated attachment, which usually tracks whether people keep using the product over time but is not the same thing. Superhuman's case shows the method can work; it does not show that 40% guarantees growth for every product, or that the steps transfer unchanged to, say, a low-price consumer app.
Worked example: running the numbers on your own survey
Say you survey 120 active users and get these answers (illustrative numbers, not Superhuman's):
| Group | Very disappointed | Total responses | Score |
|---|---|---|---|
| All respondents | 30 | 120 | 30 / 120 = 25% |
| Agency owners | 17 | 40 | 17 / 40 = 42.5% |
| Freelancers | 9 | 50 | 9 / 50 = 18% |
| Everyone else | 4 | 30 | 4 / 30 = 13% |
The formula is simply: score = "very disappointed" answers ÷ all answers in the segment. Overall you are at 25%, below the line. Agency owners are already at 42.5%. That is your beachhead.
Mind the sample size. With 40 responses in a segment, one answer moves the score by 2.5 points (1 ÷ 40), so 42.5% could easily be a few answers away from 35%. Treat any segment under about 40 responses as a direction, not a verdict, and rerun the survey as more answers come in. Ellis's test also assumes respondents have used the product recently and more than once; surveying sign-ups who churned in week one will drag the score down for reasons the survey cannot see.
What to borrow this week
- Send the four-question survey to users who have used your product at least twice in the last two weeks. Only count those users.
- Compute the score overall, then by role or company type. Find any segment at or near 40% with at least 30–40 responses.
- Code the "main benefit" answers from that segment's "very disappointed" users into a few themes. The most common one is your main benefit.
- Split the "somewhat disappointed" users by whether they named the same main benefit. Pull the blockers from the ones who did.
- Plan your next cycle as half deepen-the-benefit, half remove-the-blockers, cheapest high-impact items first. Rerun the survey on new users next month and watch the segment score.
If no segment comes near 40% even after slicing, that is useful too: it tells you to go back to customer discovery before you spend another quarter on features.
