Van Westendorp Pricing Survey: Find the Price Range Buyers Accept
A step-by-step guide to measuring willingness to pay with the four Van Westendorp questions, with spreadsheet formulas and a worked example that finds the acceptable price range.
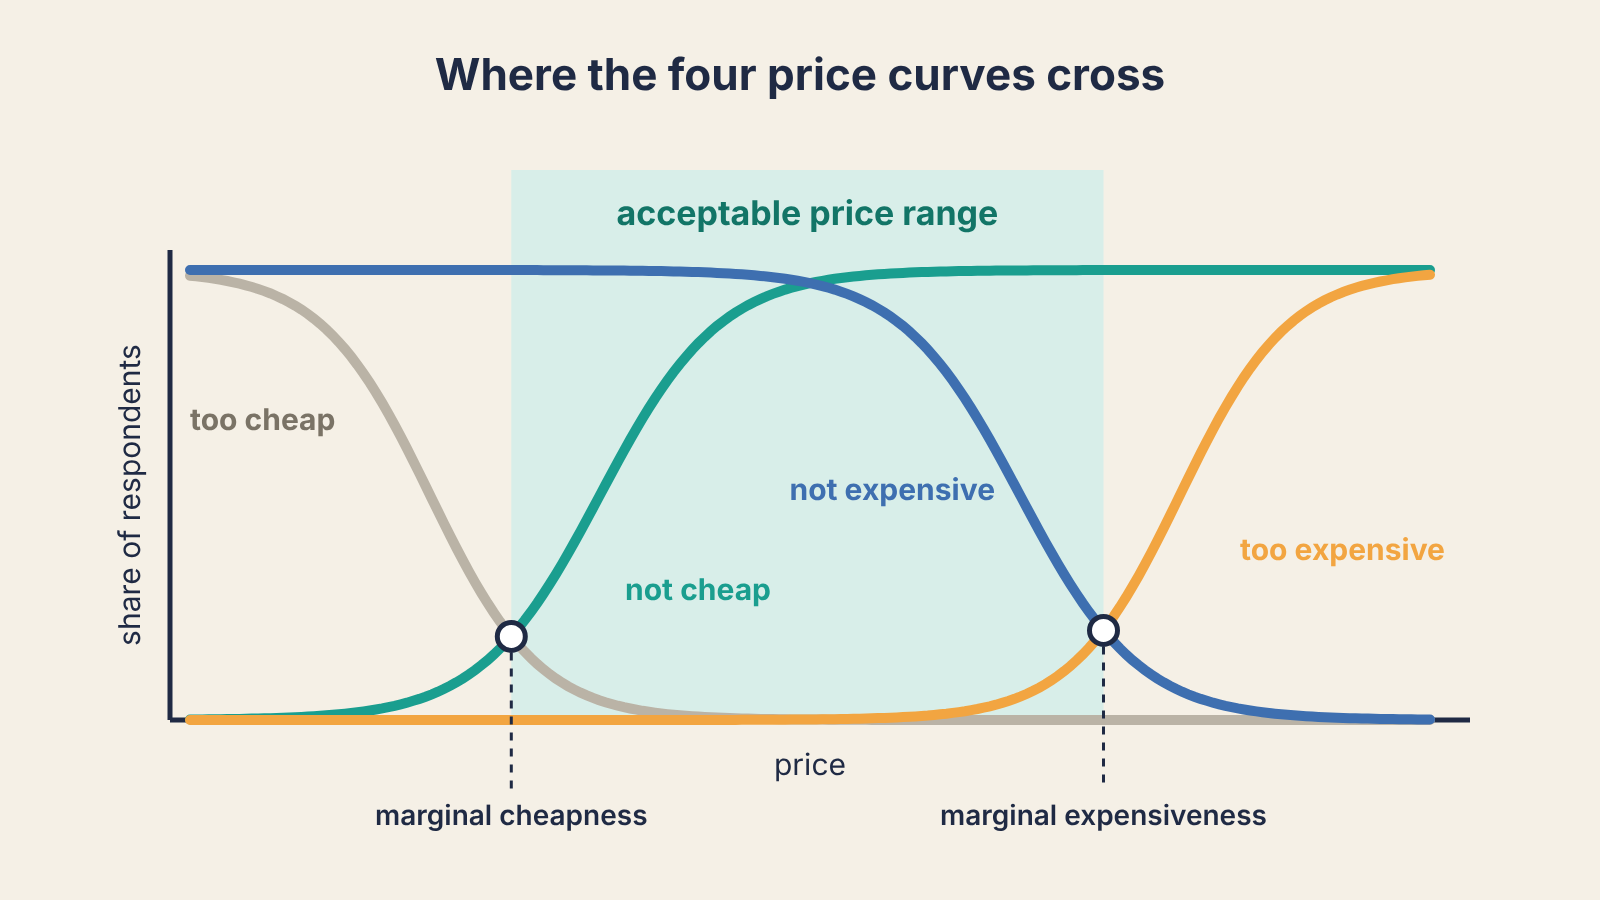
If you need a defensible first price and you have at least a few dozen people who understand your product, run a Van Westendorp survey. It asks four price questions, turns the answers into four curves, and the points where those curves cross give you a range buyers will accept. It will not tell you the one perfect price. It will tell you where the floor and the ceiling sit, which is what most seed-stage teams are actually guessing at.
The method comes from Dutch economist Peter van Westendorp, who presented it in 1976 as the Price Sensitivity Meter. It has stayed popular because it costs almost nothing to run and needs no pricing software: a form and a spreadsheet do the job.
Who should run it, and when
Run it when three things are true:
- People can picture the product. They have used it, seen a demo, or read a page that shows exactly what they get. Asking strangers to price a vague idea gives you noise.
- You know who your buyer is. Mixing answers from a solo freelancer and a 200-person company produces one blended curve that describes nobody. If you have run the Sean Ellis survey, the segment that answered "very disappointed" is the group to ask, the same way the team in our Superhuman teardown narrowed in on the users who would miss the product most.
- You have enough answers per segment. Treat 30 clean responses in one segment as a working minimum; below that, a couple of outliers move the crossing points by several dollars. More is better, and say how many you had when you share the result internally.
Time needed: an hour to set up, a week to collect answers, an hour to analyse.
The four questions
Show the respondent what the product does and what they get for the price (seats, limits, billing period). Then ask, in this order, each as an open number field:
- At what price would you consider it so cheap that you would doubt its quality? (too cheap)
- At what price would you consider it a bargain, a great buy for the money? (cheap)
- At what price would it start to feel expensive, so you would have to think about it before buying? (expensive)
- At what price would it be so expensive that you would not consider buying it? (too expensive)
Keep the unit fixed: "per month, per user" or "per year for the team", whatever you plan to sell. A respondent who answers in a different unit than the one you meant ruins the curve.
Add one question before these: what they use today for this job and roughly what it costs them. It anchors the answers in their real alternative, and it gives you a reference point when you read the results. If you already run discovery calls, the money-and-time section of our customer interview script collects the same thing in conversation.
Clean the answers before you plot anything
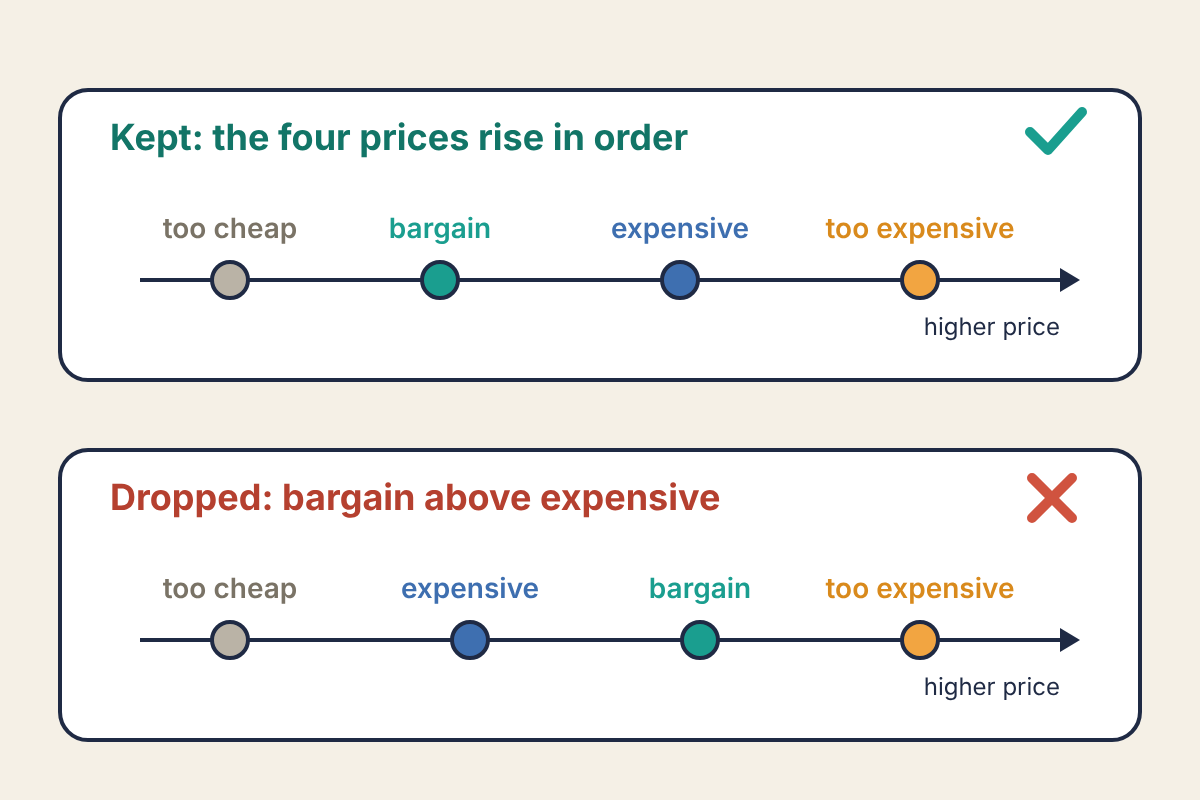
Each respondent's four numbers should rise in order: too cheap below cheap, cheap below expensive, expensive below too expensive. Some won't. People misread the questions, or type the same number twice. Drop every response where the order breaks, and count how many you dropped. If it is more than about one in five, your questions or your product description are confusing, and that matters more than the price.
Build the four curves
For each price point you care about (every $5 is fine for a SaaS product priced in tens of dollars), work out four shares of respondents:
- Too cheap: the share whose too-cheap answer is at or above this price. This falls as price rises.
- Not cheap: the share whose bargain answer is below this price. This rises.
- Not expensive: the share whose expensive answer is above this price. This falls.
- Too expensive: the share whose too-expensive answer is at or below this price. This rises.
In a spreadsheet with answers in columns A to D and the price in F2, those are =COUNTIF(A:A,">="&F2)/COUNT(A:A), =COUNTIF(B:B,"<"&F2)/COUNT(B:B), =COUNTIF(C:C,">"&F2)/COUNT(C:C) and =COUNTIF(D:D,"<="&F2)/COUNT(D:D).
The two crossings that matter:
- Point of marginal cheapness: where "too cheap" meets "not cheap". Below it, more people doubt the quality than see a fair deal.
- Point of marginal expensiveness: where "not expensive" meets "too expensive". Above it, more people rule the product out than still find it reasonable.
The space between them is the acceptable price range. You will also see the point where the cheap and expensive curves cross, often called the indifference price: as many people call it a bargain as call it expensive. Published write-ups use slightly different curve pairings for these points, so if you compare with another team's numbers, check which definition they used.
A worked example
This example is hypothetical, built to show the arithmetic. Twenty respondents in one segment (a B2B tool priced per user per month) gave four answers each, all in rising order. Here are the shares at each price:
| Price | Too cheap | Not cheap | Not expensive | Too expensive |
|---|---|---|---|---|
| $15 | 55% | 5% | 100% | 0% |
| $20 | 25% | 15% | 100% | 0% |
| $25 | 5% | 45% | 95% | 0% |
| $30 | 0% | 70% | 85% | 0% |
| $35 | 0% | 90% | 70% | 0% |
| $40 | 0% | 95% | 45% | 10% |
| $45 | 0% | 100% | 30% | 15% |
| $50 | 0% | 100% | 15% | 30% |
| $55 | 0% | 100% | 10% | 40% |
Marginal cheapness. At $20, too cheap (25%) is above not cheap (15%), a gap of +10 points. At $25 it is 5% against 45%, a gap of −40 points. The gap closes 50 points over $5, so it hits zero 10/50 of the way along: $20 + 0.2 × $5 = $21.
Marginal expensiveness. At $45, not expensive (30%) is above too expensive (15%), +15 points. At $50 it is 15% against 30%, −15 points. Halfway: $47.50.
Indifference price. Not cheap and not expensive cross between $30 (70% against 85%, a gap of −15) and $35 (90% against 70%, +20). 15/35 of the way along: $30 + 0.43 × $5 ≈ $32.
So this segment accepts roughly $21 to $47.50 per user per month, and the price where bargain and expensive balance is about $32. Twenty answers is below the 30-response minimum above, so this team would treat the range as a first read and keep collecting.
Notice what the range does not say. A price of $45 sits inside it, yet 70% of this group already call $45 expensive. "Acceptable" means few people rule it out, not that most will happily pay it. Where you land inside the range is a positioning decision: price near the bottom and you are the easy yes; price near the top and the product, the page and the sales conversation all have to justify it.
Where it misleads
- It measures what people say. Answering costs nothing, and a respondent who suspects the answers will set the price has a reason to answer low. Treat the range as a starting point for a real test, not a verdict.
- It inherits the anchor you give it. Show a feature list next to a competitor that costs $8 and answers bunch near $8. That is why the current-alternative question matters: read the results against it.
- It ignores packaging. It prices one offer. If the real question is which features go in which tier, you need a different method (feature ranking or conjoint analysis).
- The "optimal" price point is fragile. Some write-ups also read an optimal price where "too cheap" crosses "too expensive". In small samples like the one above, those two curves often never meet above zero, so do not lean on it.
After you change a price, watch what happens to new cohorts. If people who signed up at the new price fall away faster, it will show up in their curve within a few weeks; our guide to reading retention curves covers how to compare cohorts fairly.
Run it this week
- Pick one segment and write a one-paragraph description of the offer, including the billing unit.
- Build a form with the current-alternative question and the four price questions, in order, as number fields.
- Send it to people who have used or seen the product: active trial users, discovery-interview contacts, a waitlist that has seen a demo. Aim for 30 clean answers in that segment.
- Drop responses whose four prices are out of order, and note how many you dropped.
- Compute the four shares every $5 with the COUNTIF formulas above and find the two crossings by interpolation.
- Write down the range, the sample size and the current-alternative price side by side, and pick a launch price inside the range that matches how you want to be seen.
- Decide the signal you will watch after launch: trial-to-paid conversion and the retention of the first cohorts at the new price.
