Ideal Customer Profile: Find Your ICP in Retention Data
Your ideal customer profile is the segment whose retention curve flattens highest. A step-by-step method with a worked example, the margin-of-error check, and a four-line ICP template.
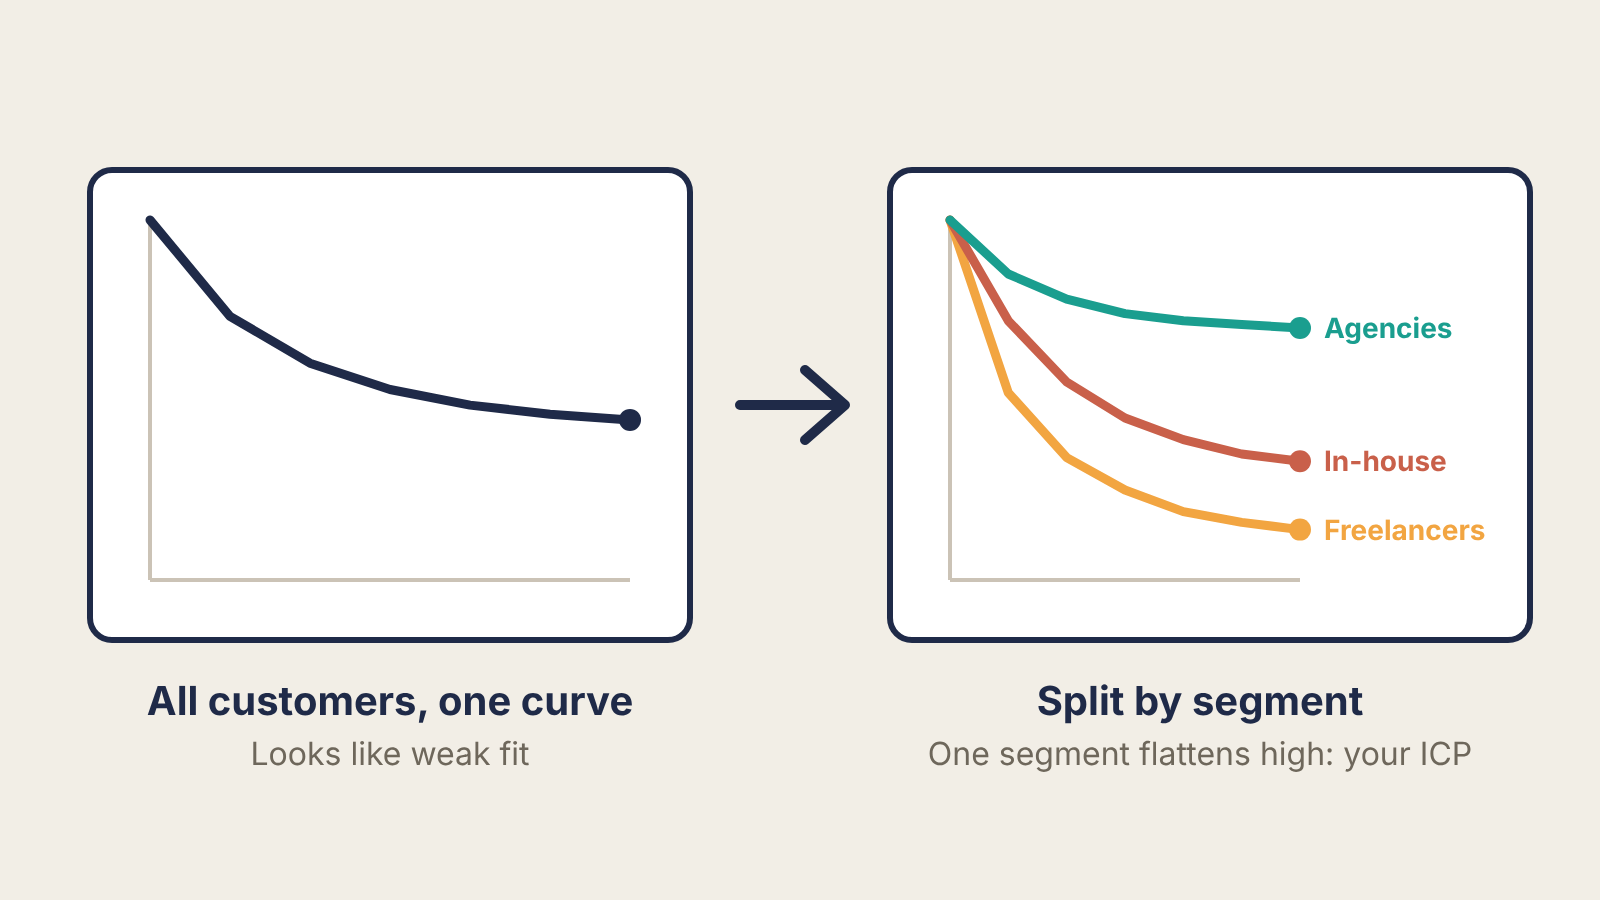
Your ideal customer profile is already sitting in your customer list. It is the group of customers whose retention curve flattens highest and who pay enough to matter, described by attributes you can check before anyone signs up. Founders who write their ICP in a workshop usually end up describing the customer they hoped for. Founders who pull it from retention data describe the one who stayed.
This is a method for teams with at least a hundred or so paying accounts or active users and six months of history. Below that, the segments are too small to read, and interviews do more for you (more on that further down).
Time needed: half a day in a spreadsheet, plus an hour to write the result up.
Why one retention curve hides your ICP
A blended retention curve averages people who love the product with people who were never going to stay. If a third of your customers retain at 70% and the rest drift towards zero, the average looks like a mediocre product. It is actually a strong product for a specific group, sold to too many other groups.

If you have not plotted cohort curves before, our guide to reading a retention curve covers how to build them and what flattening looks like. Here you draw the same curve once per segment instead of once per signup month.
Step 1: tag every account with attributes you could have known before the sale
Export every account that started at least six months ago. For each one, add columns you could have seen before they bought:
- Firmographics: company type, team size, industry, region.
- Tool stack: what they used before you, and what you integrate with.
- Trigger: why they signed up when they did, if your signup form or first call recorded it.
- Acquisition source: where they came from.
Leave out anything that only shows up after signup, such as how many features they used. Usage explains why a segment stays, which you will want later, but you cannot target a sales list or an ad by "used the export feature in week one". An ICP has to be checkable from the outside.
Step 2: compute retention and value per segment
For each segment, count accounts that started, accounts still active (or paying) at month 6, and average monthly revenue per active account. Then compute one number that combines both: retained revenue per 100 sign-ups.
Retained MRR per 100 sign-ups = 100 × (month-6 retention) × (average MRR per active account)
The worked example below is hypothetical, built to show the arithmetic. A B2B reporting tool has 240 accounts that started at least six months ago:
| Segment | Accounts | Active at month 6 | Month-6 retention | Avg MRR per active account | Retained MRR per 100 sign-ups |
|---|---|---|---|---|---|
| Agencies, 5–20 staff | 60 | 42 | 70% | $180 | $12,600 |
| Agencies, 21–100 staff | 40 | 22 | 55% | $420 | $23,100 |
| In-house marketing teams | 90 | 27 | 30% | $260 | $7,800 |
| Freelancers | 50 | 10 | 20% | $40 | $800 |
| All accounts | 240 | 101 | 42% |
Blended, 42% at month 6 looks unremarkable. Split, two things jump out. Agencies as a group retain at 64% (64 of 100), more than double the in-house teams. And the larger agencies, while they retain a bit worse than the small ones, bring nearly twice the retained revenue per 100 sign-ups because they pay more than twice as much.
Step 3: check the gap is real before you bet on it
Small segments produce big swings. A rough 95% margin of error for a retention rate is:
1.96 × √(p × (1 − p) ÷ n)
where p is the retention rate and n the number of accounts in the segment.
- Agencies combined: p = 0.64, n = 100 → 1.96 × √(0.64 × 0.36 ÷ 100) ≈ ±9 points, so roughly 55% to 73%.
- In-house teams: p = 0.30, n = 90 → 1.96 × √(0.30 × 0.70 ÷ 90) ≈ ±9 points, so roughly 21% to 39%.
Those ranges do not overlap, so the agency-versus-in-house gap is solid. Compare the two agency sizes, though: 70% on 60 accounts is about ±12 points, and 55% on 40 accounts about ±15. Those ranges overlap heavily, so this data cannot tell you that small agencies retain better than large ones. The revenue difference is large enough to matter even so. This is a normal result: the big split is clear, and the finer split needs more data.
As a working rule, do not read a segment with fewer than about 30 accounts. Merge it into a neighbour or leave it out.
Step 4: find the trigger inside the winning segment
Firmographics tell you who. The trigger tells you when they buy, which is what turns an ICP into something sales and marketing can act on. Look only at the retained accounts in the winning segment and ask what they had in common when they arrived: a signup-form answer, a note from the first call, the tool they were replacing.
In the example, suppose most retained agency accounts said they signed up to stop building monthly client reports by hand from spreadsheets and screenshots. That is the trigger and the current alternative in one line.
If your records do not hold this, call five to eight retained accounts from the segment and ask what was happening the week they signed up. Our customer discovery interview script has questions that get past polite answers to the actual situation.
Step 5: write the ICP so someone else could build a list from it
A useful ICP has four parts:
- Who: attributes visible from outside (company type, size, role of the buyer).
- Trigger: the event or recurring pain that makes them look for a fix now.
- Today: what they use instead of you. This is your real competition.
- Not for: the segments you are deliberately not serving, from the bottom of your table.
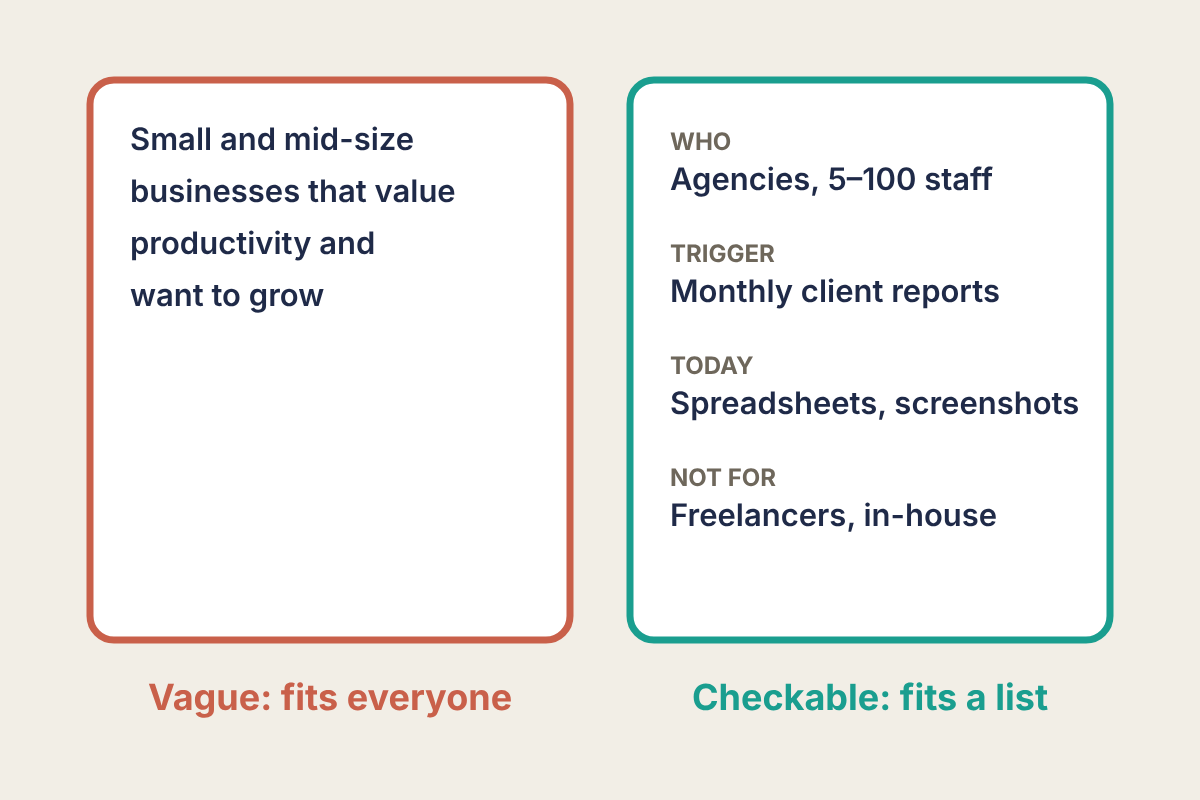
The "Not for" line is the one teams skip, and it does the most work. Writing down that freelancers are out of scope tells marketing to stop the ads that bring them in, tells sales to stop discounting to close them, and tells product to stop building the features only they ask for.
What changes once you have it
- Messaging: the homepage speaks to the trigger ("monthly client reports without the spreadsheet") instead of a category ("reporting software"). The current alternative becomes the thing you compare against.
- Pricing: ask the ICP segment what it would pay, not everyone. Our Van Westendorp pricing survey guide makes the same point: answers blended across segments describe nobody.
- Channel: look at the acquisition source column for the winning segment. If retained agencies mostly came from one place, that is the first channel to try to repeat.
- Product: the roadmap leans towards what retained ICP accounts use and ask for.
If you have too little data
With fewer than about 100 accounts, or under six months of history, the table above will be mostly noise. Two substitutes work at that stage:
- Run the Sean Ellis survey ("How would you feel if you could no longer use this product?") and segment the "very disappointed" answers. Our Superhuman teardown shows a team building its target customer from exactly those answers.
- Use activation instead of month-6 retention: the share of each segment that reaches your key action in the first two weeks. It is a weaker signal, but it arrives in days.
Treat either result as a hypothesis and recheck it against retention once you have the accounts.
Run it this week
- Export every account that started at least six months ago, with status at month 6 and current MRR.
- Add pre-sale columns: company type, team size, tool replaced, acquisition source, signup reason.
- Build the segment table: accounts, active at month 6, retention, average MRR, retained MRR per 100 sign-ups.
- Drop or merge segments under 30 accounts, and compute the margin of error for the top two segments.
- In the winning segment, list what retained accounts had in common when they arrived. Call five of them if the records are thin.
- Write the four-line ICP (who, trigger, today, not for) and test it: hand it to a colleague and ask them to name 10 companies that fit in 15 minutes. If they cannot, it is still too vague.
- Re-run the table every quarter. Watch for the winning segment's month-6 retention falling below the next segment's: that is the signal your ICP has moved.
