Instagram's Pivot Teardown: How Burbn Cut Down to the One Feature People Used
Burbn was a cluttered check-in app; its users kept coming back for one thing, photos. This startup teardown shows what the team knew, what they cut, and a feature pull audit you can run this week.
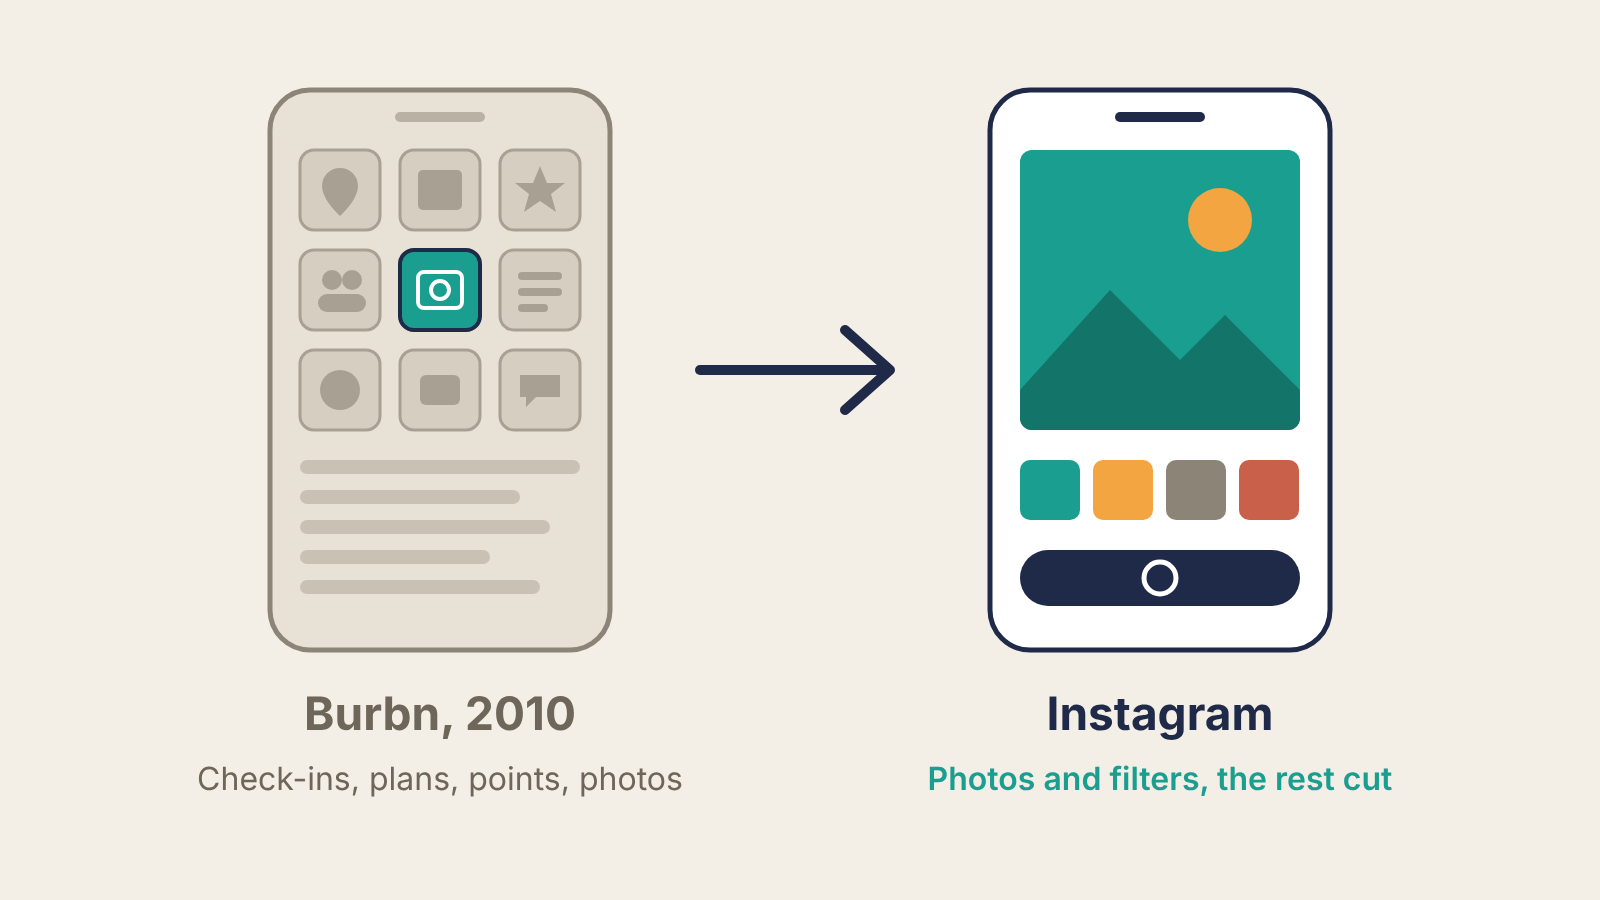
Instagram did not find product-market fit by adding a better idea. It found it by deleting most of an app. Burbn, the check-in app Kevin Systrom and Mike Krieger were building in 2010, did many things; the one its users kept coming back for was posting photos. The team cut everything else, rebuilt around photos and filters, launched as Instagram in October 2010 and had a million users by December. This startup teardown separates what the public record shows from the retold legend, then turns the move into an audit you can run on your own product this week.
The sources are TechCrunch's 2010 report on Burbn's seed round, Systrom's interview on NPR's How I Built This, Inc.'s history of Instagram, which quotes Systrom's own Quora account, The Next Web's brief history, TechCrunch's 2012 retrospective and Facebook's acquisition announcement. Most of the detail comes from the founders telling the story after a huge exit, so read it as one well-documented case, not a controlled test.
What Burbn was
Burbn was a location app in the crowded 2010 check-in category. According to The Next Web's history, users could check in at places, make plans for future check-ins, earn points for hanging out with friends and post pictures. Systrom had built the first version largely on his own and then raised money for it: TechCrunch reported in March 2010, citing unnamed sources, that Burbn had closed a seed round of about $500,000 from Baseline Ventures and Andreessen Horowitz. On How I Built This Systrom put Andreessen Horowitz's part at $250,000. Krieger joined as co-founder after the money came in.
So the starting position is a funded, two-person team with a working product that people used, but not in the way the product was designed.
The signal
The evidence for the pivot is qualitative, and it comes from the founders. Systrom wrote on Quora, as Inc. reports, that Burbn was "cluttered" and "overrun with features", and that the photo feature was by far the most popular part of the app.
That is the whole signal as the public record has it. No published dashboard, no retention curve, no share-of-users figure. What the team had was a ranking: among everything Burbn did, one feature drew more use than the others by a wide margin. Two things made that ranking worth acting on:
- The core job was losing. Check-ins were the point of Burbn, and check-ins were the thing users were not pulled toward. Building more on the core would have meant pushing against how people already used the app.
- The popular feature stood on its own. Posting a photo did not need the check-in, the plan or the points. You could remove everything around it and the thing people liked would still work.
The second condition matters as much as the first. Plenty of products have a popular feature that only works because of the rest of the product. Cutting around that kind of feature leaves nothing.
The cut
The team stripped Burbn down to photo sharing, then tightened the photo experience: square photos, filters that made phone pictures look better, and a feed of the people you follow. Inc. and The Next Web both describe an earlier attempt that did not hold. The founders first tried a photo-only prototype, set it aside, and went back to finishing an iPhone version of Burbn before committing to the photo app. The pivot was not one clean decision; it was a decision they tried, backed away from, and then made properly.
The renamed app launched in October 2010. TechCrunch's 2012 retrospective puts it at a million users by December, about ten weeks after launch. In April 2012 Facebook announced it would acquire Instagram for approximately $1 billion in cash and shares.
What they knew then versus what we know now
Hindsight makes this look inevitable. It was not.
What the team knew in 2010: one feature in their own app was used far more than the rest, the category they had built for was crowded, and the app felt cluttered. They did not know that phone photography was about to take off, that filters would matter as much as they did, or that a million people would sign up by Christmas. The fact that their first photo-only prototype was shelved shows they were not sure either.
What we know now is mostly about the outcome, and the outcome cannot be borrowed. The method can: rank what users actually do, check whether the winner can stand alone, and cut toward it instead of polishing the original plan.
There is also a survivorship problem. For every Instagram there are teams that cut down to their most-used feature and found it was popular only because it was free, novel or attached to something else. The Burbn story is evidence that subtraction can work, not that it usually does. The same caution applies to the Slack pivot, where the winning product was also hiding inside a project that was failing.
What to borrow: the feature pull audit
Burbn's signal was "people use this one thing more." You can measure that directly instead of waiting for it to be obvious. Run this audit on any product with more than a few dozen weekly active users.
The formula. For each feature:
feature reach = weekly active users who used the feature that week ÷ weekly active users
retained reach = the same ratio, counted only among users who are still active in week 4 after signup
The second number matters more. A feature everyone tries once is curiosity. A feature that retained users keep using is pull.
A worked example. These numbers are illustrative, not Burbn's. Say your app has 800 weekly active users, and 300 of them have been active for at least four weeks.
| Feature | Used this week (all 800) | Reach | Used this week (300 retained) | Retained reach |
|---|---|---|---|---|
| Check in | 520 | 65% | 96 | 32% |
| Plans | 160 | 20% | 30 | 10% |
| Points | 240 | 30% | 45 | 15% |
| Photos | 360 | 45% | 255 | 85% |
Check-ins have the highest overall reach because onboarding pushes everyone through them. Among users who stayed, photos lead by a wide margin: 85% retained reach against 32%. That gap, where the feature you lead with is not the feature retained users live in, is the pattern Burbn's founders described.
Then ask the stand-alone question. For the leading feature, list what it depends on. If it needs the rest of the product to work, you have found a strength, not a new product. If it works with everything else removed, you have a candidate for a cut.
The threshold to watch. Act when one feature's retained reach is at least double the core feature's and the gap holds for three consecutive weeks. One week can be a launch spike. Below roughly 100 retained users, treat the ranking as a lead for customer discovery interviews, not a decision. This threshold is our rule of thumb, not a published benchmark.
Test the cut before you commit. Build the stripped-down version as a separate app or a separate onboarding path, put new users through it, and compare their week-4 retention with the full product's. Read the result the way you would read any retention curve: you want the stripped version's curve to flatten higher, not just start higher.
Run the audit this week with whatever event data you already log. If your core feature wins on retained reach, keep building it. If something else wins by double, you may be holding a Burbn.
