DAU/MAU Ratio: The Formula, a Worked Example and When It Misleads
DAU/MAU tells you how many days a month a typical user comes back. The formula, a worked example, how to read it for daily and weekly products, the traps, and a SQL query to run this week.
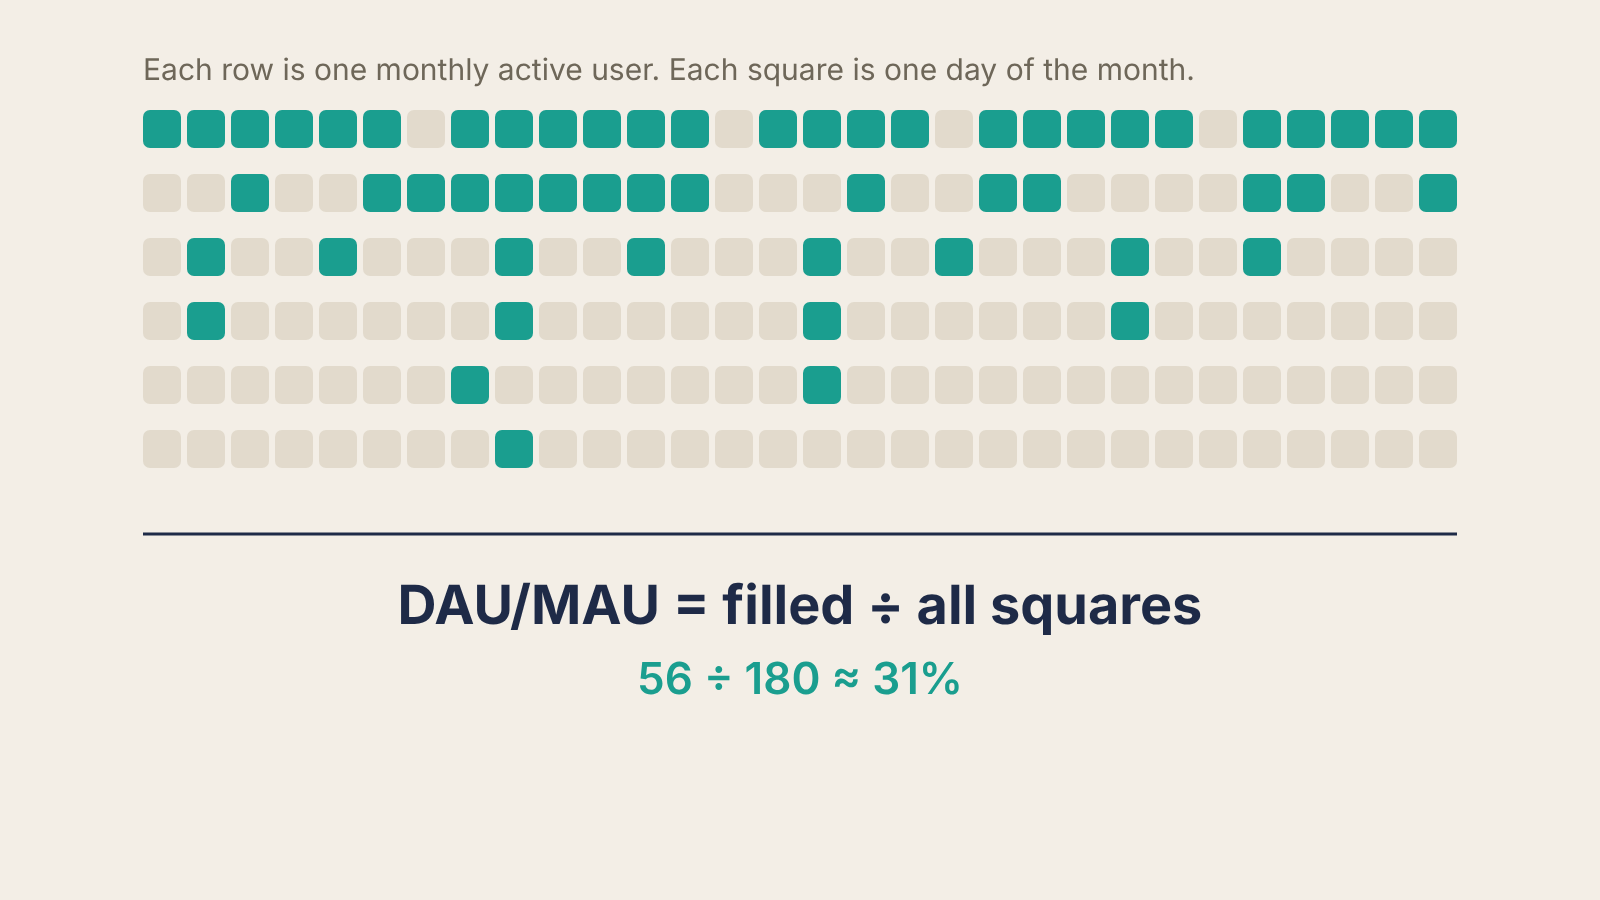
DAU/MAU is the share of your monthly users who show up on an average day. Take the average number of daily active users over a month, divide it by the number of users active at least once in that month, and you get a number between 0 and 1. Read it another way and it tells you how many days of the month a typical user comes back: a DAU/MAU of 25% means the average monthly user is active about 7.5 days out of 30. That second reading is the useful one, and it is also where most of the mistakes start.
The formula
DAU/MAU = average DAU over the period ÷ MAU for the same period
- DAU is the count of distinct users who did your core action on a given day. Average it across every day of the window; do not use one day.
- MAU is the count of distinct users who did the core action at least once in the window, usually the trailing 30 days.
Because average DAU is the total number of active user-days divided by the days in the window, the ratio simplifies:
DAU/MAU = active user-days ÷ (MAU × days in window)
That is the picture in the illustration above. Each monthly user gets a row of 30 squares, one per day. Fill in the days they were active. DAU/MAU is filled squares divided by all squares. With six users active on 26, 15, 8, 4, 2 and 1 days, that is 56 of 180 squares, about 31%: one heavy user and a long tail of light ones average out to a typical user showing up about nine days a month.
A worked example
These numbers are illustrative. A B2B note-taking tool has 2,400 users who created or edited a note at least once between 1 and 30 October. Adding up each day's distinct active users across the month gives 18,000 active user-days.
- Average DAU = 18,000 ÷ 30 = 600
- DAU/MAU = 600 ÷ 2,400 = 25%
- Days active per monthly user = 25% × 30 = 7.5
Now the trap most dashboards fall into. On Monday 7 October, 900 people were active. If someone reports "DAU 900, MAU 2,400, stickiness 37.5%", they have quoted a Monday. On Saturday 12 October only 250 were active, which would give about 10%. Neither number is the product's stickiness. Use the 30-day average, or plot DAU/MAU from a trailing seven-day average of DAU so weekdays and weekends cancel out.
How to read it
DAU/MAU measures how often people come back, not whether they stay. It complements a retention curve, which answers the second question; a product can have a flat, healthy retention curve and a low DAU/MAU at the same time. Whether that is a problem depends on how often the job your product does comes up.
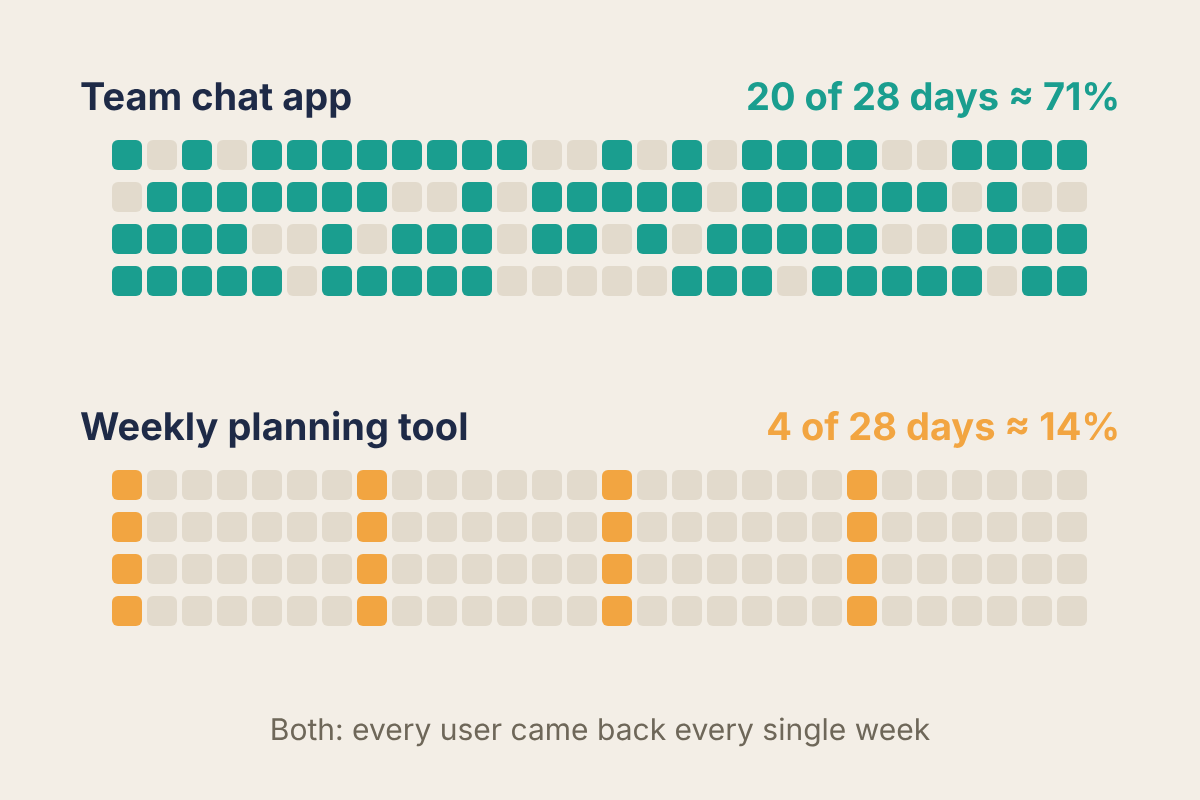
A planning tool used every Monday has users who never miss a week and a DAU/MAU near 14%. That is the ceiling for a weekly habit on a 28-day window, not a failure. Judging it against a chat app teaches the team to chase daily engagement it should not want: notifications, streaks, reasons to open the app that serve the metric instead of the user.
So before you read the number, write down the natural cadence of your core job:
- Daily (messaging, team chat, a habit app): DAU/MAU is the right ratio.
- Weekly (planning, payroll runs, a weekly report): use WAU/MAU, or count how many of the last four weeks each monthly user was active.
- Monthly or event-driven (invoicing, tax, travel booking): frequency ratios mislead. Use retention by cohort and, for paying customers, net revenue retention.
The traps
Defining "active" as a login. If opening the app counts, a reminder email that gets people to open it and leave raises DAU/MAU without anyone getting value. Count the action that delivers the product's value: sending a message, editing a document, completing a lesson.
Growth spikes push the ratio down. A launch that brings in 1,000 sign-ups in the last week of the month adds 1,000 to MAU but at most seven active days each. DAU/MAU falls even if every existing user is as engaged as before. Split the number into new users (first active this month) and existing users, and read the existing-user ratio for engagement.
Small samples swing. With 80 monthly users, one heavy user joining or leaving can move the ratio by several points. Below a few hundred MAU, look at the distribution instead of the ratio: a histogram of days active per month (1, 2, 3 … 30), sometimes called a power user curve or L28. A healthy product grows a cluster on the right; a failing one piles up on the left at one or two days.
Borrowed benchmarks. Figures quoted for "good" DAU/MAU circulate widely, mostly from single investor blog posts and from consumer social apps, with no stated sample. We are not repeating any of them. Compare your number with your own trend and with products whose core job has the same cadence as yours.
Calendar months versus trailing windows. February has 28 days and a month with a holiday week has fewer working days. A trailing 28-day window always holds four of each weekday, which makes month-to-month comparisons fair.
What it says about product-market fit
On its own, very little. A rising DAU/MAU among existing users, with the same definition of active, says the product is becoming part of people's routine. That supports a fit claim, alongside a retention curve that flattens and an answer to the question Superhuman asked its users: how disappointed would you be if you could no longer use this. Slack's early teams were judged on whether they kept using the tool without being asked, which is the behaviour a high DAU/MAU among existing users reflects.
Run it this week
If your events land in a SQL warehouse, this query gives the trailing 28-day DAU/MAU for existing users, with "active" as your core action:
WITH days AS (
  SELECT DISTINCT user_id, DATE(event_time) AS day
  FROM events
  WHERE event_name = 'core_action'
    AND event_time >= CURRENT_DATE - INTERVAL '28 days'
    AND event_time <  CURRENT_DATE
),
existing AS (
  SELECT user_id FROM users
  WHERE signup_date < CURRENT_DATE - INTERVAL '28 days'
)
SELECT
  COUNT(*) * 1.0 / (COUNT(DISTINCT d.user_id) * 28) AS dau_mau,
  COUNT(DISTINCT d.user_id) AS mau
FROM days d
JOIN existing e USING (user_id);
Then do three things with the result:
- Multiply the ratio by 28 to get days active per user, and ask whether that matches how often the job comes up.
- Run the same query with a seven-day window for WAU and check WAU/MAU if your cadence is weekly.
- Save the number every Monday. The threshold to watch is direction, not level: three weeks of decline among existing users, with an unchanged definition of active, is worth an investigation before anything else on the roadmap.
