Churn Rate: The Formula, a Worked Example and the Mistakes That Skew It
Monthly churn rate is customers lost ÷ customers at the start of the month. This guide works through an example, shows why monthly × 12 is wrong, how to turn churn into lifetime, and how much churn moves by chance at startup sample sizes.
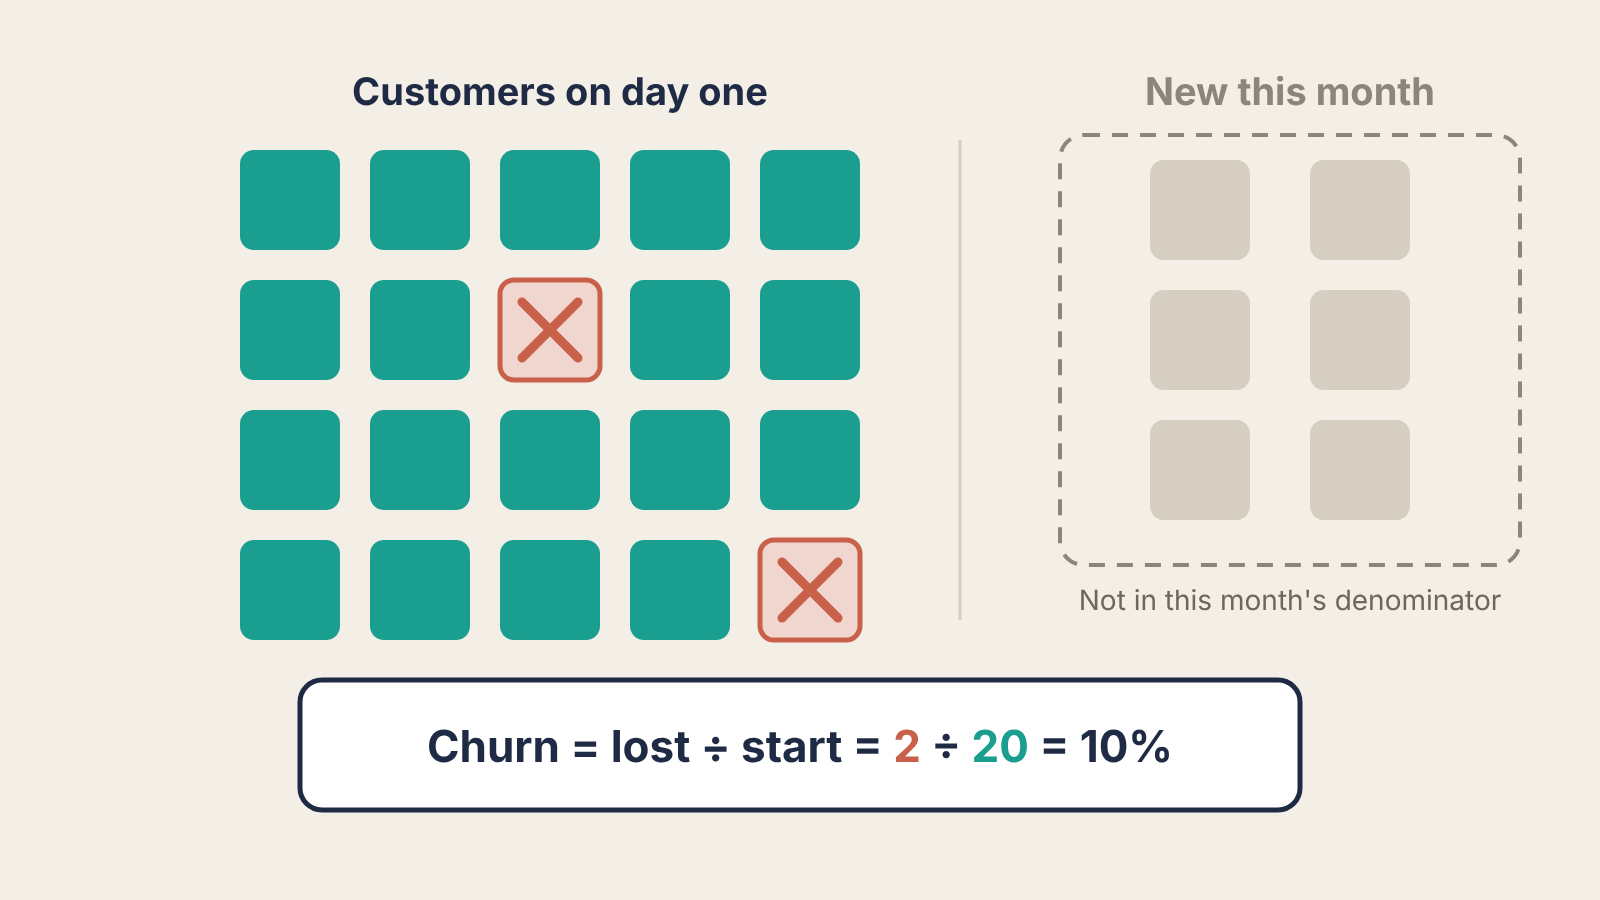
Monthly churn rate is the share of the customers you had at the start of a month who cancelled during that month. Customers lost ÷ customers at the start. That is the whole formula, and most of the ways churn gets misreported come from changing one of those two numbers without saying so: counting new sign-ups in the denominator, mixing in customers who cancelled in their first week, or multiplying a monthly rate by twelve.
This post gives the formula, a worked example with every step shown, the conversions people get wrong (monthly to annual, churn to lifetime), and how much a churn number can move by chance at early-stage sample sizes. It covers customer churn, sometimes called logo churn. For the revenue side, where downgrades and upgrades count, see net revenue retention, which also covers gross revenue retention.
The formula
Customer churn rate = customers lost during the period ÷ customers at the start of the period
- Customers at the start: everyone paying (or active, if you are not charging yet) on day one of the period.
- Customers lost: those same customers who cancelled, or stopped renewing, by the last day.
Customers who signed up during the period are not in either number. They were not there at the start, so they cannot be counted as lost from it. Track what happens to them separately, because a new customer who leaves in week one is telling you something different from a two-year customer who leaves.
A worked example
These numbers are illustrative. A subscription tool starts March with 400 paying customers. During March:
- 18 of those 400 cancel.
- 60 new customers sign up, and 4 of the new ones cancel before the month ends.
- So the tool ends March with 400 − 18 + 60 − 4 = 438 customers.
Customer churn = 18 ÷ 400 = 4.5%
Now the two versions you will see in dashboards and pitch decks:
| Method | Calculation | Result |
|---|---|---|
| Start-of-month customers (correct) | 18 ÷ 400 | 4.5% |
| All losses over start plus new | (18 + 4) ÷ (400 + 60) | 4.8% |
| All losses over end-of-month customers | (18 + 4) ÷ 438 | 5.0% |
Here the wrong methods make churn look worse. Swap the numbers around, with many new customers and few early cancellations, and the same mistakes make it look better. Either way you can no longer compare one month with the next, because the figure moves with how many people you signed, not with how many you kept.
The 4 new customers who left within the month go in their own line: first-month cancellations, 4 ÷ 60 = 6.7%. If that number is much higher than your churn among established customers, the problem is activation or the promise that sold them, not the product's long-run value. The retention curve shows the same thing by cohort age.
Monthly to annual: do not multiply by twelve
4.5% a month is not 54% a year. Each month's churn applies to fewer customers than the month before, because the ones who left are already gone.
Annual churn = 1 − (1 − monthly churn)^12
1 − (1 − 0.045)^12 = 1 − 0.955^12 = 1 − 0.576 = 42.4%
So at a steady 4.5% a month, about 42% of a starting group is gone after a year, and about 58% is still there. Multiplying by twelve overstates annual churn by more than ten points here, and the gap grows as churn rises. Going the other way, from an annual figure to monthly: monthly churn = 1 − (1 − annual churn)^(1/12).
Churn to customer lifetime: a rough guide only
Average customer lifetime ≈ 1 ÷ monthly churn
1 ÷ 0.045 = 22.2 months.
This formula assumes churn is the same every month for every customer, which it almost never is. Most products lose new customers fastest and established ones slowly, so the curve flattens. With that shape, 1 ÷ churn mixes two groups and gives a lifetime that fits neither: too long for the people who leave in month two, too short for the ones who stay for years. Use it as a sanity check, and use cohort curves for any decision that depends on lifetime value.
How much of the change is noise
At early-stage numbers, churn moves a lot by chance. A rough 95% range for a churn rate is:
churn ± 1.96 × √(churn × (1 − churn) ÷ customers at start)
For the example: √(0.045 × 0.955 ÷ 400) = √0.000107 = 0.0104, and 1.96 × 0.0104 ≈ 0.020. So 4.5% means somewhere between about 2.5% and 6.5%.
That has a practical consequence. If churn goes from 4.5% one month to 3.5% the next on 400 customers, you cannot tell that apart from chance. Do not credit the onboarding change you shipped. Wait for two or three months moving the same way, or compare cohorts of customers who did and did not get the change. This is the standard normal approximation, and it gets shaky below about 10 lost customers a month; at that size, read the cancellations one by one instead of the rate.
Where churn hides fit, and where it shows it
A single blended churn rate can hide a segment that has fit. If agencies churn at 1.5% and freelancers at 9%, a blended 4.5% looks like a weak product, when it is a strong product for one group. Split churn by plan, acquisition channel and customer type before you decide anything. The method for finding the segment that stays is in finding your ICP in retention data.
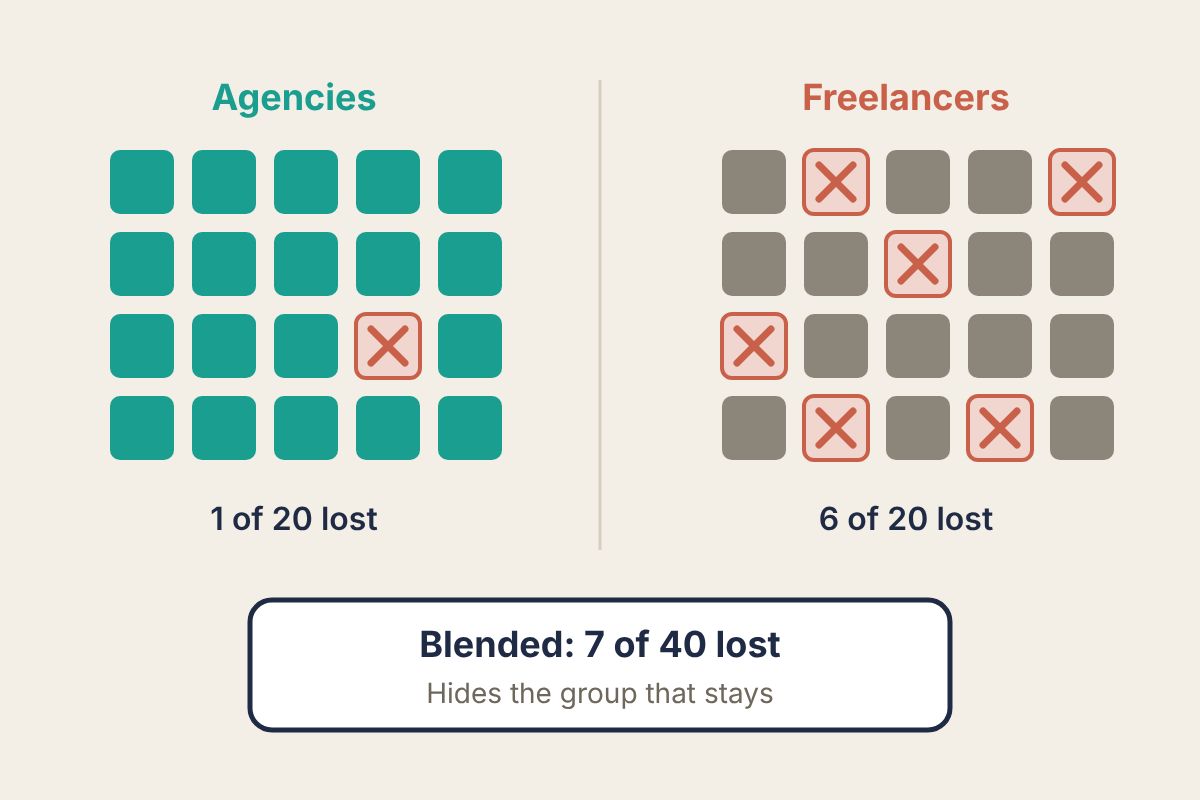
The reverse also happens. Low churn on an annual plan can hide customers who stopped using the product months ago and have not reached their renewal date. Pair churn with a usage measure such as DAU/MAU so you see disengagement before it turns into cancellations.
Set it up this week
- Pull a list of customers active on the first day of each of the last six months, with their cancellation dates.
- For each month, compute lost ÷ start, with new sign-ups excluded. Put first-month cancellations in a separate column.
- Add the ± range from the formula above to each month, so nobody reads noise as progress.
- Split the latest three months by plan and by customer type. Look for one group whose churn is less than half the overall rate.
- Report annual churn with the compounding formula, never monthly × 12.
If one segment's churn is less than half the blended rate and holds for three months, that segment is where to look for fit. That threshold is our rule of thumb, not a published benchmark.
