Net Revenue Retention: The Formula, a Worked Example and the Traps
Net revenue retention shows whether your existing customers' revenue grows without new sales. The NRR and GRR formulas, a worked example, why the same NRR can hide two different businesses, and the mistakes that inflate it.
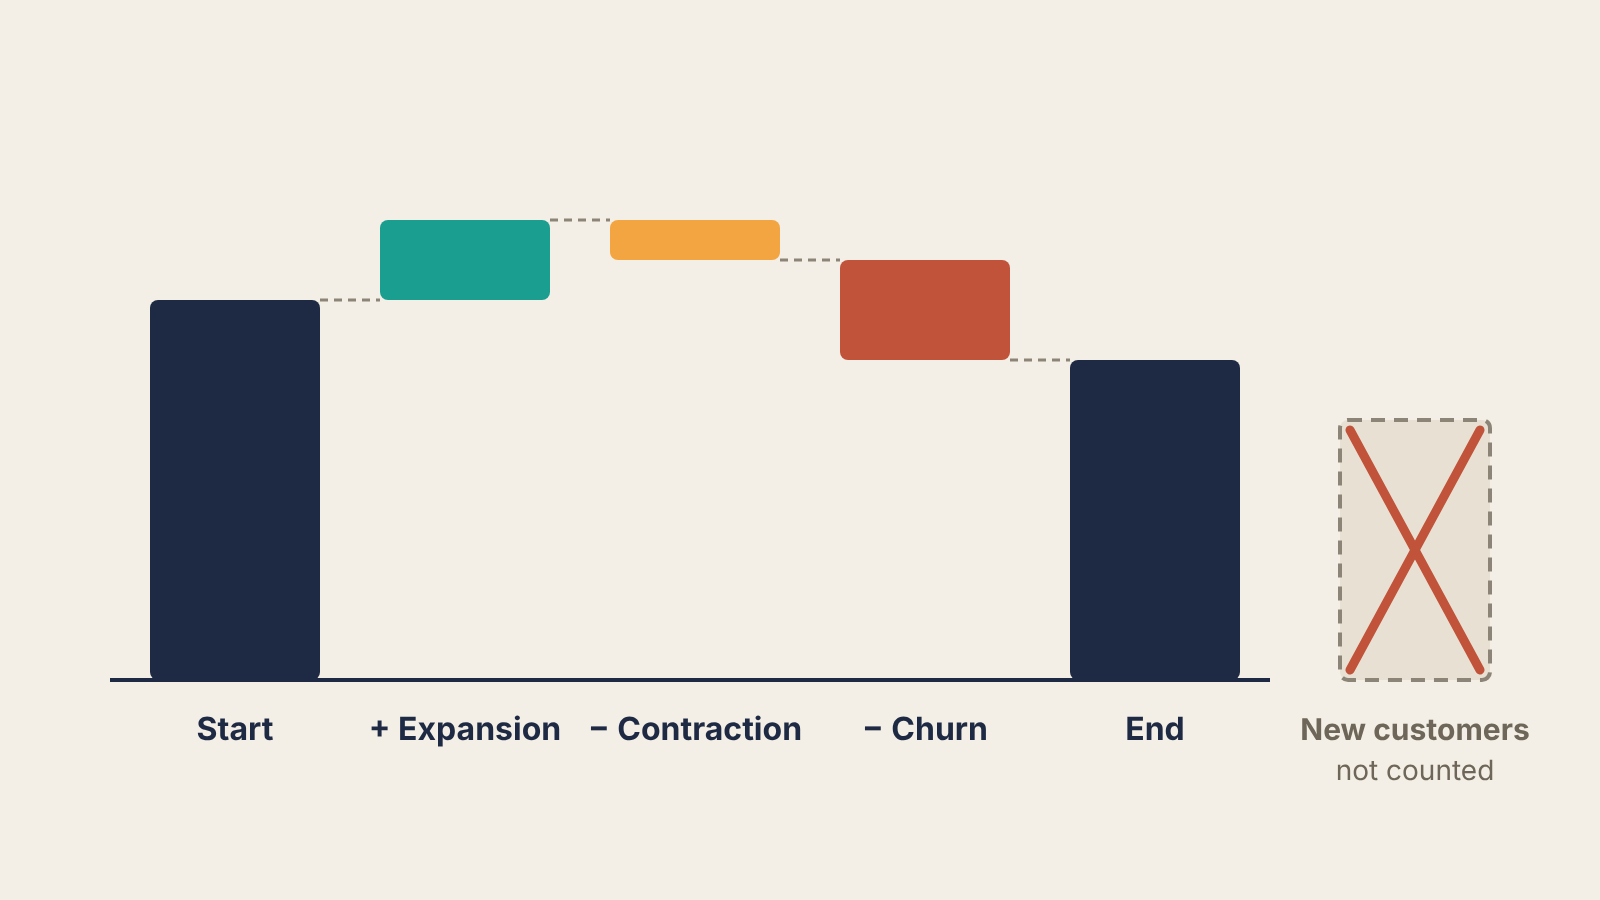
Net revenue retention (NRR) answers one question: if you stopped signing new customers today, would the revenue from the customers you already have grow or shrink over the next year? Take a fixed group of customers, compare what they pay now with what they paid twelve months ago, and leave every newer customer out. Above 100% means the group grew on its own. Below 100% means you have to keep selling just to stand still.
For a founder looking for product-market fit in a subscription business, NRR is the revenue version of the retention curve. The curve tells you whether people keep using the product. NRR tells you whether the customers who stay are paying you more, the same, or less. This post gives the formula, a worked example, its partner metric gross revenue retention (GRR), and the mistakes that make the number look better than the business.
The formula
Pick a start date. Take the customers who were paying on that date and their monthly recurring revenue (MRR) then. Twelve months later, look at the same customers only.
NRR = (starting MRR + expansion − contraction − churned MRR) ÷ starting MRR
- Starting MRR: what those customers paid per month on the start date.
- Expansion: extra monthly revenue from the same customers: upgrades, more seats, add-ons, usage growth.
- Contraction: lost monthly revenue from customers who stayed but pay less: downgrades, fewer seats.
- Churned MRR: the full monthly revenue of customers who left.
New customers signed during the year are not in it, at all. That exclusion is the point of the metric.
The partner metric: gross revenue retention
GRR = (starting MRR − contraction − churned MRR) ÷ starting MRR
GRR is NRR without expansion. It can never be above 100%, because it only counts what you lost. Report both. NRR on its own can hide a leaking business behind a few customers who grew fast.
A worked example
A B2B tool has 40 paying customers on 1 January, paying $20,000 MRR in total. These are illustrative numbers. Twelve months later, looking only at those 40:
| Movement | Customers | MRR change |
|---|---|---|
| Upgraded or added seats | 9 | +$4,200 |
| Downgraded | 4 | −$900 |
| Cancelled | 6 | −$2,600 |
| No change | 21 | $0 |
NRR = ($20,000 + $4,200 − $900 − $2,600) ÷ $20,000 = $20,700 ÷ $20,000 = 103.5%
GRR = ($20,000 − $900 − $2,600) ÷ $20,000 = $16,500 ÷ $20,000 = 82.5%
Read together: the customers who stay are getting more value and paying for it, which is a good sign. But nearly a fifth of starting revenue left in a year. Without the nine upgraders, this cohort would be shrinking. The next question is not "how do we expand more" but "why did those six leave, and were they the customers we are actually built for?"
Any customers signed after 1 January, even if they now pay $10,000 a month, change nothing above. That revenue shows up in growth, not retention.
Same NRR, different businesses
Two companies can report the same NRR and be in very different shape.
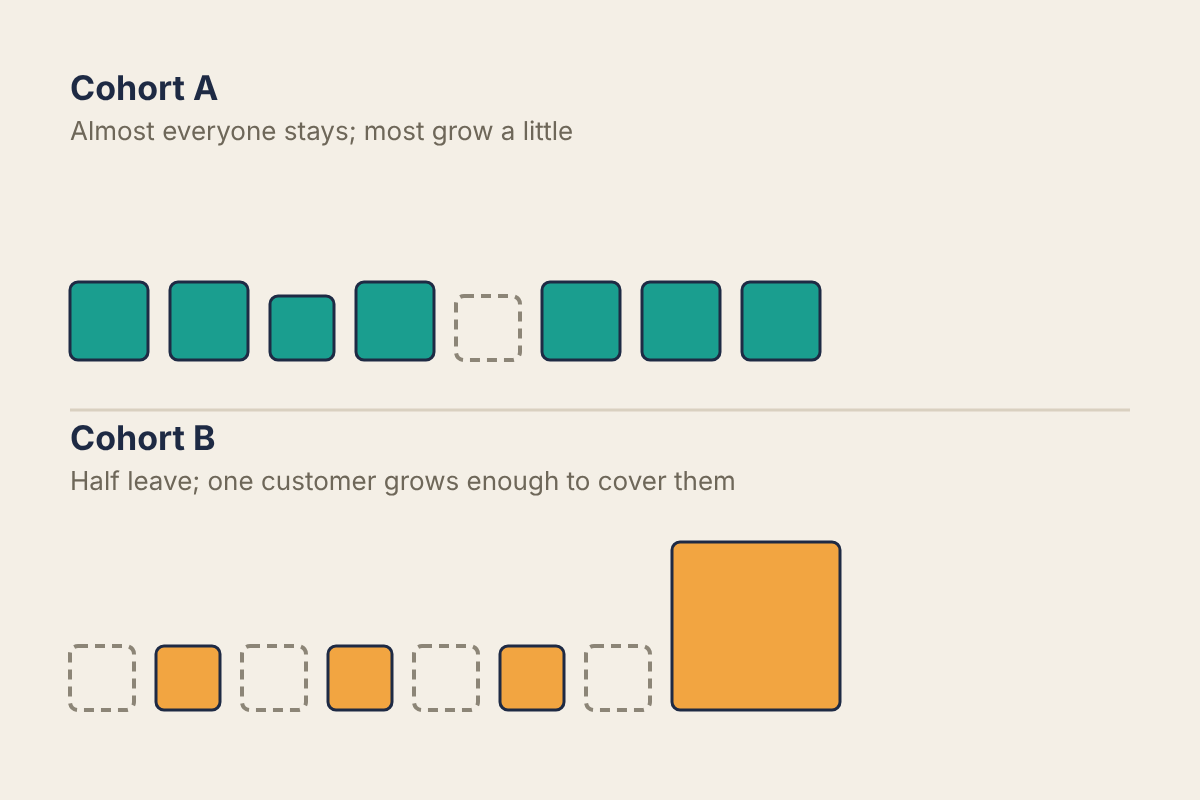
In the first, nearly every customer stays and most grow a little. In the second, several customers leave and one large customer grows enough to cover them. The second business has a concentration problem and probably a fit problem with most of its customers. Its NRR will fall the moment that one account stops growing or leaves. GRR, and a count of how many customers churned (the customer churn rate), shows the difference immediately.
Mistakes that inflate the number
- Counting new customers. Comparing total MRR now with total MRR a year ago is revenue growth, not retention. It is the most common error.
- Counting reactivations as expansion. A customer who left and came back is a win-back. Count them separately or not at all, and say which.
- Price increases. A list-price rise raises NRR without anyone getting more value. Note it when you report, or show NRR with and without it.
- Using a short window and annualising. One month's NRR multiplied out to a year swings wildly with a single upgrade. Use a twelve-month cohort, or report the monthly number as monthly.
- Annual contracts. Customers on annual plans cannot churn mid-term, so a cohort full of them looks great until renewals arrive. Split the cohort by contract length if you have both.
Companies define NRR in different ways in their public filings and investor decks (trailing or point-in-time, which revenue counts, what happens to customers below a threshold). Write your definition down once, and when you compare against anyone else's figure, check that it is the same calculation.
When NRR is worth tracking
NRR needs a year of paying customers and enough of them for one account not to swing it. With 40 customers in the example, one cancellation of a $500 account moves NRR by 2.5 points ($500 ÷ $20,000). Under about 20 to 30 paying customers, treat it as a direction and list the movements customer by customer instead of quoting a percentage.
Before that, at pre-seed and early seed, usage retention and the very-disappointed survey Superhuman used tell you more, sooner. NRR becomes the sharper tool once you have paying cohorts and a product with room to grow inside an account: seats, usage or tiers. A product with one flat price can still track GRR, but its NRR can never rise above it.
What to run this week
- Export every paying customer with their MRR on a date twelve months ago and their MRR today. Customers who were not paying twelve months ago go in a separate sheet.
- Tag each remaining customer as expanded, contracted, churned or unchanged, and total the MRR change for each tag.
- Calculate NRR and GRR with the formulas above.
- List the churned customers by segment. If most of the lost revenue sits in one segment, that is a candidate for the market you do not fit.
- If one customer accounts for more than half of all expansion, calculate NRR again without them and report both numbers.
