Pivot or Persevere: Run the Decision Meeting Against Bars Set in Advance
Most teams without fit never decide; they give it another month. This pivot or persevere playbook sets three bars before each cycle, three decision rules, a 60-minute meeting script and a template you can use this week.
Decide whether to pivot or persevere in a 60-minute meeting, on a fixed date, against numbers you wrote down before you looked at the results. Most teams that drift for a year without fit never made a bad call. They never made a call at all, because every review ended with "the numbers are mixed, let's give it another month". This playbook replaces that with a scorecard, three decision rules and a meeting script you can run this week.
The idea of a regular pivot-or-persevere meeting comes from Eric Ries's book The Lean Startup. The scorecard, thresholds and script below are our own way of running it; treat the thresholds as starting points to adjust, not published benchmarks.
Who it is for: a pre-seed to Series A team with a product in users' hands, at least 30 active users or 10 paying customers, and no clear fit signal yet. Time needed: two hours to set up the scorecard, then a 60-minute meeting every six to eight weeks.
Step 1: Write the scorecard before the cycle starts
Pick three numbers, no more. Each one needs a bar: the value at which you would be confident enough to keep going. Write the bars down and share them with everyone who will be in the meeting, before the cycle's data exists.
- A usage number, usually week-4 retention for the cohorts that signed up during the cycle: the share of a cohort still active four weeks after signing up. Read it the way you would read any retention curve: is it flattening, and where?
- A pull number: the share of active users who answer "very disappointed" to the question "How would you feel if you could no longer use this product?" Sean Ellis's 40% line is the usual bar; it is one practitioner's benchmark, and the Superhuman teardown shows how one team used it. Ask only users who have used the product at least twice in the last two weeks.
- A money or commitment number: paid conversion, renewals, or, before you charge, a costly action such as a signed pilot or a pre-order. For B2B, monthly churn rate among paying customers works.
Also write down, in one sentence, the segment the bars apply to. A bar for "all users" invites the debate you are trying to avoid.
Step 2: Agree the three decision rules in advance
The rules turn the scorecard into a decision before anyone has a stake in the result.
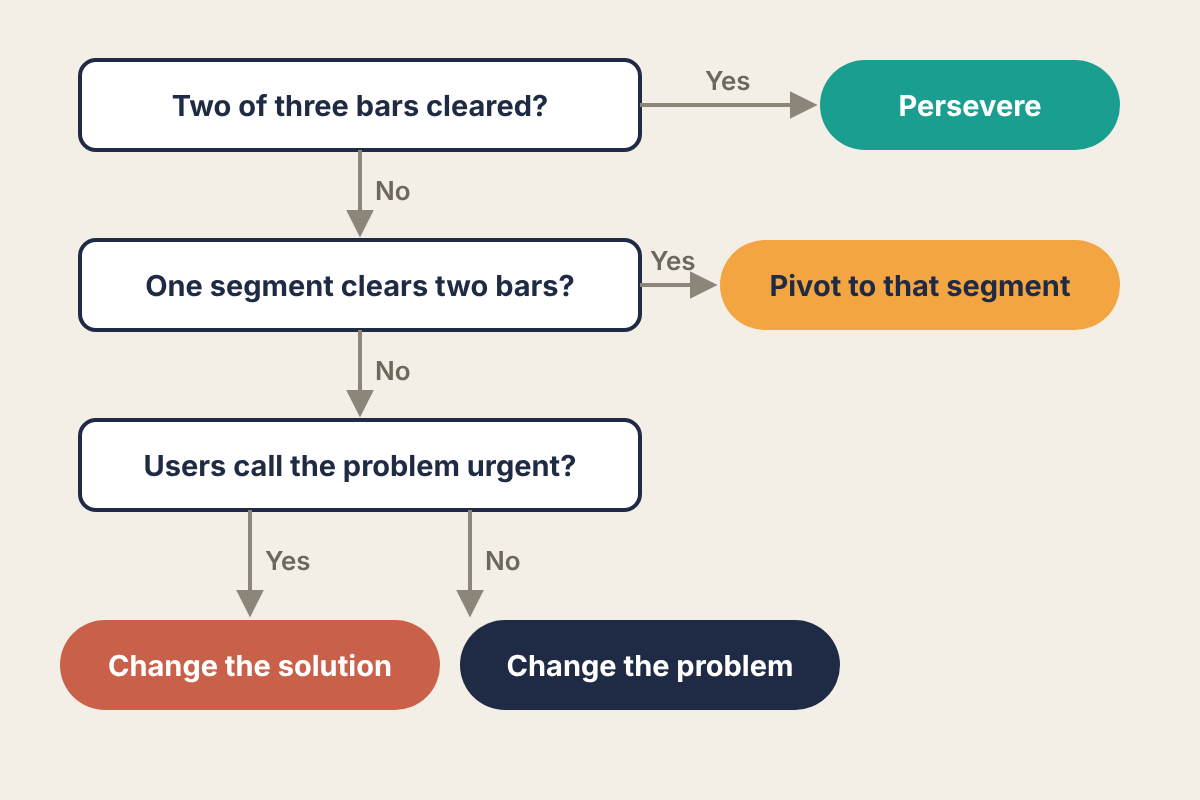
- Persevere when at least two of the three numbers clear their bars, and the third is moving toward its bar for two cycles in a row. Keep the strategy; change tactics.
- Pivot when none of the three clears its bar, or when one does but has moved away from it two cycles running.
- Split the decision when the blended numbers miss but one segment clears at least two bars on its own. That is a customer-segment pivot: keep the product, change who it is for. The ICP from retention data method shows how to find that segment.
Anything else, such as one bar met and two missed, defaults to pivot unless the team can name the one change that would move a missed number past its bar within the next cycle. "We need more time" is not a change.
When the rules say pivot and no segment clears its bars, decide the kind of pivot from your interview notes. If users describe the problem as urgent and the product simply did not solve it, change the solution. If they do not call it urgent, change the problem you are working on.
Step 3: Gather the evidence the week before
Two days before the meeting, one person (not the founder who argues hardest for the current plan) fills in the scorecard from the raw data and sends it out. Include:
- The three numbers for the cycle, for the whole user base and for each segment with at least 20 users.
- The previous two cycles' numbers next to them.
- Five quotes from users who answered "very disappointed" and five from those who did not. If you have not talked to users this cycle, run five customer discovery interviews first.
Step 4: Run the meeting
Sixty minutes, with a fixed agenda:
- Read the scorecard (10 minutes). No discussion. Each number is above or below its bar.
- Apply the rules (10 minutes). The note-taker walks the decision flow out loud and writes down where it stops.
- Challenge the data, not the rule (20 minutes). You may question whether a number was measured right. You may not move a bar. If the team believes a bar was wrong, change it for the next cycle and record why.
- Choose the move (15 minutes). If persevere: the one tactic to change. If pivot: which kind (segment, problem, solution, or a zoom-in on one feature, as in the Instagram pivot) and the cheapest test of it.
- Write the next scorecard (5 minutes). New bars, new date.
A worked example
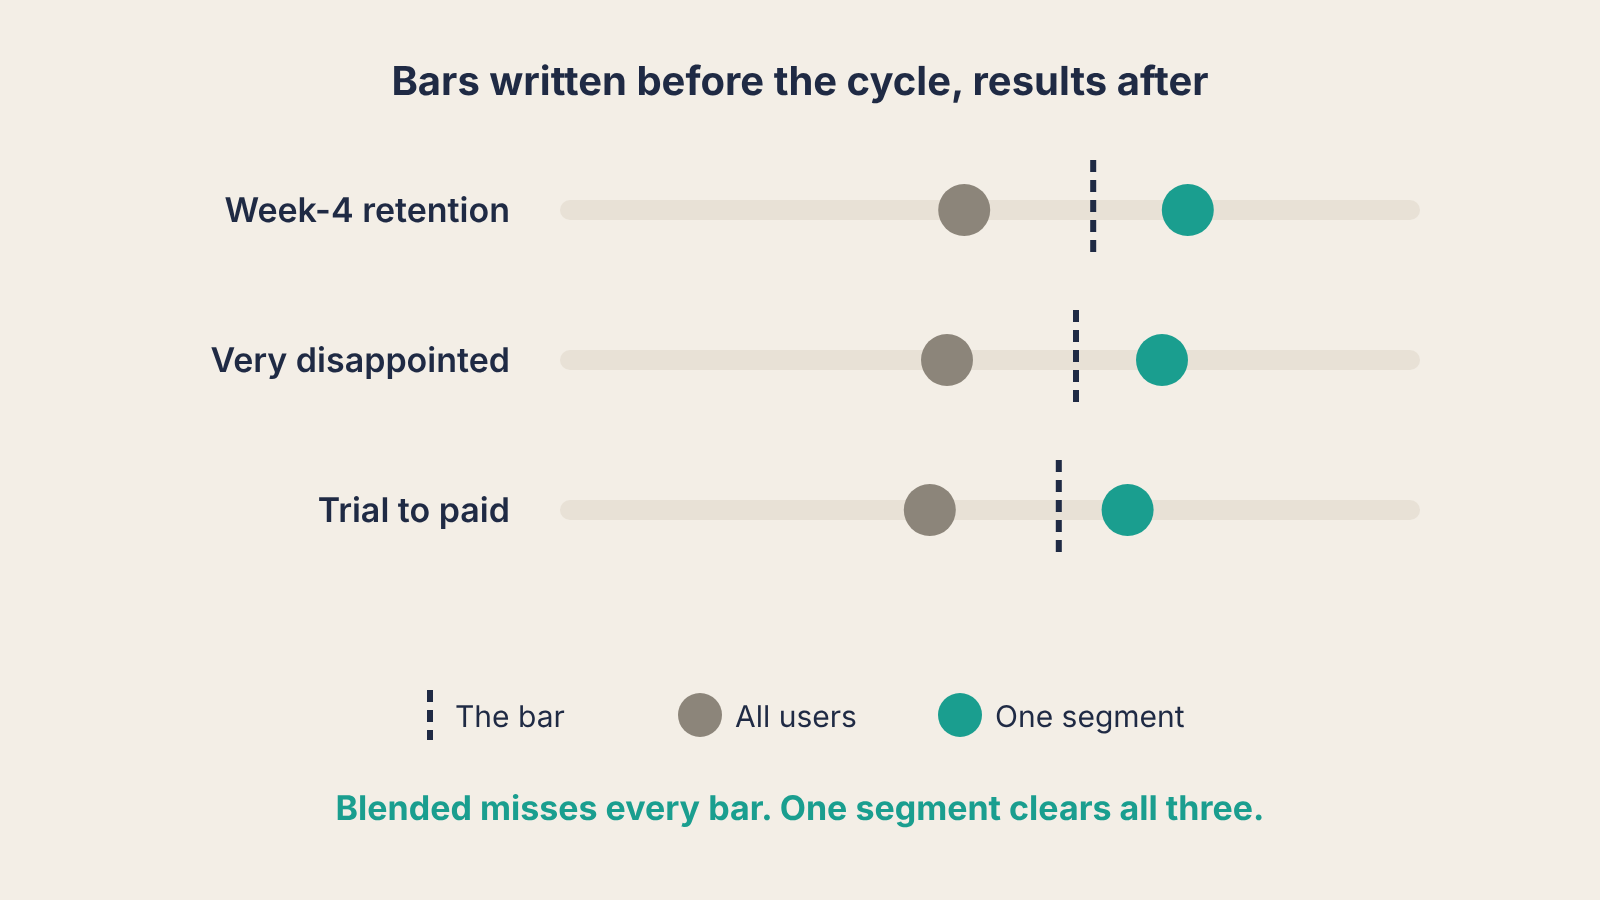
These numbers are illustrative. A scheduling tool for clinics has 140 active users across two segments after an eight-week cycle. The bars were set before the cycle: week-4 retention 35%, "very disappointed" 40%, paid conversion from trial 15%.
| Number | Bar | All users | Physiotherapy clinics (60) | Dental practices (80) |
|---|---|---|---|---|
| Week-4 retention | 35% | 26% | 43% | 14% |
| Very disappointed | 40% | 29% | 48% | 15% |
| Trial to paid | 15% | 11% | 17% | 6% |
The blended numbers miss all three bars, so a quick read says pivot the product. The rules say something narrower. Physiotherapy clinics clear all three bars on their own, so the decision is a segment pivot: stop selling to dental practices, rewrite the onboarding and site for physio clinics, and set next cycle's bars for that segment alone.
The arithmetic matters here. The blended retention is (0.43 × 60 + 0.14 × 80) ÷ 140 = (25.8 + 11.2) ÷ 140 = 26.4%. The weaker, larger segment drags the average down far enough to hide a segment that is working.
Caveat the sample: 60 clinics is enough to act on as a direction, not to treat as proof. A 43% retention rate on 60 users has a 95% range of roughly ±13 points (1.96 × √(0.43 × 0.57 ÷ 60) ≈ 0.125). Next cycle confirms or overturns it.
The template
Copy this into a doc before the cycle starts.
- Cycle dates: start, end, meeting date
- Segment this applies to: one sentence
- Usage number and bar: e.g. week-4 retention ≥ 35%
- Pull number and bar: e.g. "very disappointed" ≥ 40%, asked of users active twice in 14 days
- Commitment number and bar: e.g. trial to paid ≥ 15%
- Rules: persevere if 2 of 3 clear and the third is improving; pivot if 0 clear; segment pivot if one segment clears 2 of 3; anything else is pivot unless one named change can close the gap this cycle
- Owner of the scorecard: a name
- Decision and next move: filled in at the meeting
Set the date for the first meeting before you close this page. The rule that matters most is the one you can only follow in advance: write the bars down before you see the numbers.
